


More Southern Californians are purchasing motor vehicles, particularly those who were previously transit-dependent, which largely explains the region's declining transit ridership, according to a newly released study.
The report, Falling Transit Ridership: California and Southern California, by Michael Manville, Brian D. Taylor, and Evelyn Blumenberg of the UCLA Institute of Transportation Studies, was released Jan. 31. Commissioned by the six-county Southern California Association of Governments (SCAG), it was written to better understand the trend of falling transit ridership and help inform planners and policymakers on how to address it.
"Although the research was limited to Southern California, it could have big implications if similar patterns are found elsewhere," writes Governing’s transportation and infrastructure reporter, Daniel C. Vock.
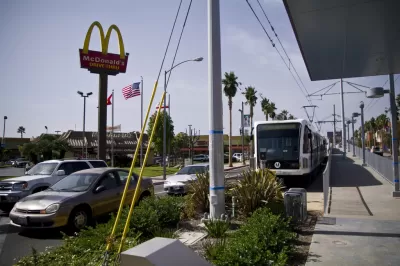
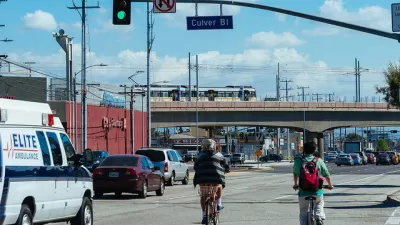
As posted last month, transit ridership in Los Angeles County dropped 15 percent in 5 years despite the opening of new light rail extensions.
Experts and officials have no firm answers, but have attributed the decline to a combination of factors, including changes to immigration policy, competition from Uber and Lyft and more people buying cars — as well as perceived problems with existing transit service and security, wrote Laura J. Nelson, who covers transportation and mobility issues across Southern California for the Los Angeles Times, on Jan. 25.
"As data has revealed multi-year decreases of up to 25% [across Southern California], experts and officials have stopped debating whether the decline exists, and have instead turned their attention to why," writes Nelson on Feb. 1.
The study of U.S. Census data and ridership figures, prepared by the UCLA Institute of Transportation Studies, called the increase in car ownership a "smoldering, if not a smoking, gun" to suggest why transit ridership across the region fell by 72 million trips over a five-year period.
Auto ownership data backs up that assertion. According to the study:
Between 2000 and 2015, private vehicle ownership dramatically increased among households in the SCAG region, from 1.7 to 2.4 vehicles per household. During the 1990s, the region grew by 1.8 million people and 456,000 household vehicles, or 0.25 cars per new resident. But from 2000 to 2015, the region added 2.3 million people and 2.1 million household vehicles, nearly one car per new resident.
To exacerbate transit's ridership loss, "car ownership has grown fastest among the most frequent transit riders," write the authors. Here's where the report's finding may not be transferable to areas with more widespread, demographic transit usage, rather than focused on those who are transit-dependent, lower income, and often immigrants.
A small portion of Southern California residents take the majority of all transit trips: Less than 3 percent of the region’s population rides transit very frequently, another 20 percent rides occasionally, and more than three-quarters of residents ride transit rarely or never
"It's unclear what was driving the higher vehicle ownership rates, especially because wages were stagnant," writes Vock of Governing.
But there are many indications that low-income consumers are taking on more vehicle-related debt. Between 2000 and 2015, inflation-adjusted per capita vehicle debt in California rose 91 percent, according to the study.
[Co-author] Evelyn Blumenberg says vehicles could be more of a necessity among low-income residents because jobs and housing continue to spread into suburban areas.
Co-author Brian D. Taylor has for years urged transit agencies to focus on denser areas best served by transit, adds Vock.
“The biggest declines have been on the best lines in the whole state,” Taylor wrote. This evidence is consonant with these “neighborhoods becoming more affluent, with that affluence being associated with less transit use and with people left out of that affluence remaining on transit."
A contrasting perspective is offered on Feb. 6 by Planetizen blogger, Michael Lewyn, although he looks at nationwide transit ridership decline.
Streetsblog LA's Joe Linton offers a critical review of the UCLA-ITS report. "[T]he diagnosis is far from conclusive, and nearly no prescriptions are offered," he writes. Linton also contrasts ridership data with other metropolitan regions.
From 2000 to 2016, the Bay Area and San Diego area saw modest increases in transit ridership. California ridership was down due to declines in L.A. and Orange Counties.
That observation helps to explain how the SCAG six-county region of Imperial, Los Angeles, Orange, Riverside, San Bernardino, and Ventura Counties was responsible for 120 percent of the state's total transit trip loss from 2012 to 2016, a bewildering finding stated on the report's webpage.
"Bay Area transit agencies, including San Francisco's Muni, have bucked the declining ridership trend, with trips increasing by 20%," observed Nelson of the Times.
What about ride-hailing?
So much for those surveys that suggested ride-hailing would lead to a reduction in car ownership. The study also explains why ride-hailing can't be blamed as the main cause of the loss of transit riders.
"Transit ridership started its decline in 2007, but the ride-hailing apps weren’t even introduced until 2009 and weren’t widely adopted until 2012," writes Vock.
“What little evidence we do have suggests that most [ride-hailing] trips do not replace transit trips,” the researchers wrote:

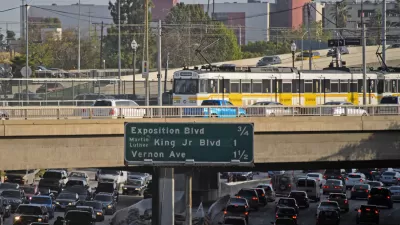
L.A. Transit Ridership Drops 15 Percent in 5 Years Despite New Light Rail Extensions
Bus riders, comprising about three-quarters of Los Angeles Metro ridership, declined 21 percent since 2013, But it wasn't just bus routes—two light rail lines also lost riders.

Southern California's Metrolink Defies Declining Ridership Trends
Primarily serving commuters in the Greater Los Angeles metro area, Metrolink just attained the highest annual ridership in its 27-year existence. Officials chalk up the increase to a significant investment in marketing.
Report: Modest Congestion Charge Would Produce Dramatic Results in Los Angeles
Applying a cordon toll as low as $4 in Los Angeles would result in a 20% reduction in traffic congestion and modest increases in transit ridership, walking, and biking, according to a new study from the Southern California Association of Governments.

Maui's Vacation Rental Debate Turns Ugly
Verbal attacks, misinformation campaigns and fistfights plague a high-stakes debate to convert thousands of vacation rentals into long-term housing.

Planetizen Federal Action Tracker
A weekly monitor of how Trump’s orders and actions are impacting planners and planning in America.

San Francisco Suspends Traffic Calming Amidst Record Deaths
Citing “a challenging fiscal landscape,” the city will cease the program on the heels of 42 traffic deaths, including 24 pedestrians.

Opinion: What San Francisco’s Proposed ‘Family Zoning’ Could Really Mean
Mayor Lurie is using ‘family zoning’ to encourage denser development and upzoning — but could the concept actually foster community and more human-scale public spaces?

Jacksonville Launches First Autonomous Transit Shuttle in US
A fleet of 14 fully autonomous vehicles will serve a 3.5-mile downtown Jacksonville route with 12 stops.

‘Big, Beautiful Bill’ Guts EV Tax Credits
The bill eliminates federal subsidies for electric vehicle buyers and charging stations.
Urban Design for Planners 1: Software Tools
This six-course series explores essential urban design concepts using open source software and equips planners with the tools they need to participate fully in the urban design process.
Planning for Universal Design
Learn the tools for implementing Universal Design in planning regulations.
Gallatin County Department of Planning & Community Development
Heyer Gruel & Associates PA
JM Goldson LLC
City of Camden Redevelopment Agency
City of Astoria
Transportation Research & Education Center (TREC) at Portland State University
Jefferson Parish Government
Camden Redevelopment Agency
City of Claremont