


Over the past two years or so, transit ridership has begun to decline. It seems that this decline has been most widespread among cities with relatively weak transit systems.

Between 1995 and 2015, American transit ridership rose from 7.8 billion trips to 10.6 billion. But over the past couple of years, transit ridership in most cities has began to dip. Between the third quarter of 2016 and the third quarter of 2017, U.S.ridership declined by 3 percent. (Ridership also declined slightly in 2015.)
Why has ridership been declining? I’d like to focus on two possible explanations. One explanation focuses on the rise of alternatives to both private automobiles and public transit, such as Uber and bicycling.
If this explanation were a major factor, we would expect to see ridership declines in the cities where taxicabs and bicycling were most common. Although I have found no data on taxi use by city, I would guess that these cities would be the most compact, walkable, transit-oriented cities. There are four major cities where fewer than half of urban commuters use a car to get to work: Boston, New York, San Francisco and Washington. In all four cities, transit ridership decreased by 3-5 percent over the last year, roughly the same as the national average. In 2015-16, transit ridership actually increased in three of the four cities (all but Washington).
Adding Philadelphia, Seattle, and Chicago (where 60-67 percent of commuters drive) doesn’t change this result very much: Chicago’s 2016-17 decline was close to the national average, Philadelphia declined a bit more (by just over 5 percent), and Seattle ridership rose. Similarly, in 2015-16 transit ridership rose in Seattle, while declining modestly (1-3 percent) in Philadelphia and Chicago. In sum, ridership in the least auto-oriented cities is roughly in line with national trends; it seems to me that if taxis and bicycling were the major cause of ridership decline, those cities would be experiencing larger ridership declines than other cities.
A second explanation focuses on economic growth; as the economy has improved and gas prices have flattened out, it might be the case that more working-class riders can afford to buy cars, and that a few riders who already owned cars can afford to drive more. Thus, people who could not afford cars during the recession have become "choice riders" and that some of them have exercised the choice to drive.
It seems to me that if this view were correct, transit ridership would decline most significantly in cities where most people use cars daily—for example, cities in which over 90 percent of commuters drive to work. Major cities in this category include Columbus, El Paso, Fort Worth, Indianapolis, Jacksonville, Memphis, Nashville, and San Antonio. The data modestly supports this hypothesis: in five of the eight cities, ridership declined more than the national average (by between 4 and 7 percent) between the third quarter of 2016 and the third quarter of 2017. Ridership declined by about the same as the national average in Indianapolis, and by less than the average in Nashville(2 percent) and Columbus (0.7 percent).
What about in 2015-16 (when national ridership declined by 1.6 percent)? In six of the eight "90 percent car" cities, transit ridership declined by more than the national average, ranging from 4 percent in Nashville to 8 percent in Fort Worth. In two other cities (Columbus and Jacksonville), ridership declined but by less than 1 percent.
On balance, it seems that ridership has declined the most in cities where transit was already rather weak, and thus that the national ridership decline may be related to the growing economy. But next year's data might support a different hypothesis.

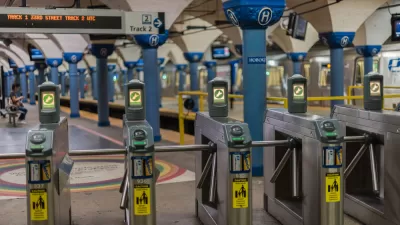
NYC Mobility Report: Transit Ridership Drops While Population Grows
A new report from the New York City Department of Transportation opens the administrations of Governor Andrew Cuomo and Mayor Bill de Blasio to criticism from Streetsblog NYC.
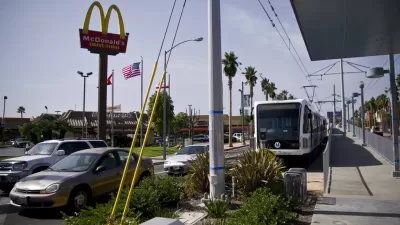
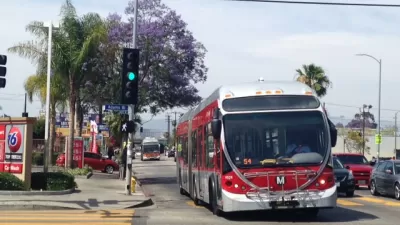
Southern California's Declining Transit Ridership, Explained
More Southern Californians are purchasing motor vehicles, particularly those who were previously transit-dependent, which largely explains the region's declining transit ridership, according to a newly released study.
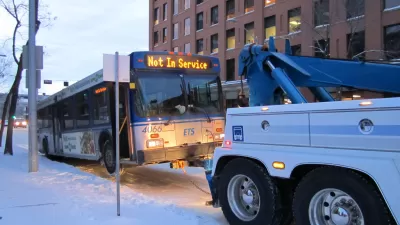
Time to Worry About Declining Bus Ridership Again
The news about the decline of bus ridership around the country is making the rounds again. The future of bus transit as we know it seems to be in question.

Planetizen Federal Action Tracker
A weekly monitor of how Trump’s orders and actions are impacting planners and planning in America.

Maui's Vacation Rental Debate Turns Ugly
Verbal attacks, misinformation campaigns and fistfights plague a high-stakes debate to convert thousands of vacation rentals into long-term housing.

San Francisco Suspends Traffic Calming Amidst Record Deaths
Citing “a challenging fiscal landscape,” the city will cease the program on the heels of 42 traffic deaths, including 24 pedestrians.

Defunct Pittsburgh Power Plant to Become Residential Tower
A decommissioned steam heat plant will be redeveloped into almost 100 affordable housing units.

Trump Prompts Restructuring of Transportation Research Board in “Unprecedented Overreach”
The TRB has eliminated more than half of its committees including those focused on climate, equity, and cities.

Amtrak Rolls Out New Orleans to Alabama “Mardi Gras” Train
The new service will operate morning and evening departures between Mobile and New Orleans.
Urban Design for Planners 1: Software Tools
This six-course series explores essential urban design concepts using open source software and equips planners with the tools they need to participate fully in the urban design process.
Planning for Universal Design
Learn the tools for implementing Universal Design in planning regulations.
Heyer Gruel & Associates PA
JM Goldson LLC
Custer County Colorado
City of Camden Redevelopment Agency
City of Astoria
Transportation Research & Education Center (TREC) at Portland State University
Jefferson Parish Government
Camden Redevelopment Agency
City of Claremont