California is demonstrating that improving the economy and the environment go hand in hand. A new inventory report from the state's Air Resources Board notes changes in gross domestic product, population, and greenhouse gas emissions since 2000.

A compelling chart introducing the new 2015 Greenhouse Gas (GHG) Emissions Inventory for the state of California illustrates the trends in the economy and the environment: GDP and population increase while greenhouse gas (GHG) emissions, GHG per capita, and GHG per GDP decrease.
"This data shows once again that California’s groundbreaking greenhouse gas emission-reduction programs are working as designed,” said Mary D. Nichols, chair of the California Air Resources Board (CARB). “These numbers clearly indicate that the state is on track to achieve its 2020 emission reduction goals and that California can grow its economy while continuing to fight climate change.”
The economic, if not the environmental, changes have not gone unnoticed, even by rival states such as Texas, reports Lydia DePillis, business reporter for the Houston Chronicle, on June 7.
For a few years, while California was dogged by a real estate crisis and state budget deficit and Texas' oil boom was just starting to take off, Texas had reason to brag.
But recently, those trends have reversed. The New Yorker traced California's return to economic health back in 2015, after Gov. Jerry Brown balanced the budget and a new tech boom took off.
DePillis points to several macroeconomic indicators to illustrate the reversal in the two state economies, including:
-
California's economy grew faster than Texas' in 2016, 2.9 percent to 0.4 percent.
-
Texas' unemployment rate bumped above California's this past March.
-
Average wages in California, which are already a few dollars an hour higher than in Texas, grew faster than they did in the Lone Star state for most of the past year.
Back to the progress report on reducing greenhouse gas emissions:
"California, the sixth-largest economy in the world, has advanced its nation-leading climate goals while also growing the economy," states the press release. [A caveat about that oft-quoted ranking: Politifact noted last year that when "adjusting for the state’s high cost of living, California’s GDP ranking drops to 11th in the world, according to the California Legislative Analyst’s Office."].
Four programs are largely credited for putting the state on track to meeting the goal of reducing GHG emissions to 1990 levels by 2020 as mandated by the Global Warming Solutions Act of 2006 (aka AB 32), signed by former Republican Governor Arnold Schwarzenegger.
- Renewables Portfolio Standard, [per SB 350, 50 percent renewables used for electricity generation by 2050]
- the Advanced Clean Cars Program [dependent on continuing the vehicle emissions waiver from the U.S. Environmental Protections Agency],
- the Low Carbon Fuel Standard requiring a 10 percent reduction in the carbon intensity of transportation fuels by 2020.
- the Cap-and-Trade Program, "a market based regulation that is designed to reduce greenhouse gases (GHGs) from multiple sources."
Missing from the list: the Sustainable Communities and Climate Protection Act of 2008, aka SB 375, requiring regional agencies to reduce emissions through transportation and land use improvements.
Progress in reducing emissions is uneven according to the 17-page trends report [pdf].
The transportation sector remains the largest source of GHG emissions in the state, accounting for 37% of the inventory, and had an increase in emissions in 2015. Emissions from the electricity sector [19%] continue to decline due to growing zero-GHG energy generation sources.
After 2020, the Air Resources Board will be guided by a new goal for 2030: reducing GHG emissions by 40 percent below 1990 emission levels (SB 32). One of the main challenges will be continuing the cap-and-trade program that expires in 2020. A new program has been proposed, but the legislation needs to pass by a two-thirds supermajority.
Hat tip to Sierra Club California.
FULL STORY: New Report Shows California is Reducing Greenhouse Gas Emissions as Economy Continues to Grow

Planetizen Federal Action Tracker
A weekly monitor of how Trump’s orders and actions are impacting planners and planning in America.

Restaurant Patios Were a Pandemic Win — Why Were They so Hard to Keep?
Social distancing requirements and changes in travel patterns prompted cities to pilot new uses for street and sidewalk space. Then it got complicated.

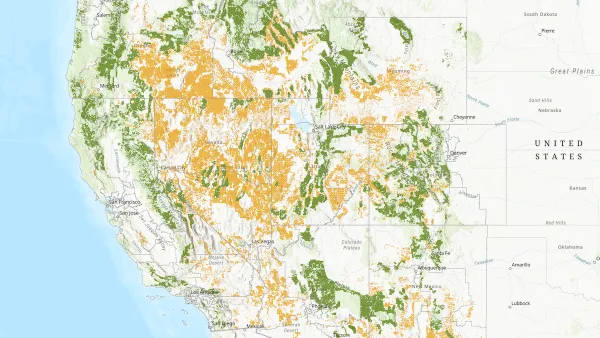
Map: Where Senate Republicans Want to Sell Your Public Lands
For public land advocates, the Senate Republicans’ proposal to sell millions of acres of public land in the West is “the biggest fight of their careers.”

Maui's Vacation Rental Debate Turns Ugly
Verbal attacks, misinformation campaigns and fistfights plague a high-stakes debate to convert thousands of vacation rentals into long-term housing.

San Francisco Suspends Traffic Calming Amidst Record Deaths
Citing “a challenging fiscal landscape,” the city will cease the program on the heels of 42 traffic deaths, including 24 pedestrians.

California Homeless Arrests, Citations Spike After Ruling
An investigation reveals that anti-homeless actions increased up to 500% after Grants Pass v. Johnson — even in cities claiming no policy change.
Urban Design for Planners 1: Software Tools
This six-course series explores essential urban design concepts using open source software and equips planners with the tools they need to participate fully in the urban design process.
Planning for Universal Design
Learn the tools for implementing Universal Design in planning regulations.
Heyer Gruel & Associates PA
JM Goldson LLC
Custer County Colorado
City of Camden Redevelopment Agency
City of Astoria
Transportation Research & Education Center (TREC) at Portland State University
Camden Redevelopment Agency
City of Claremont
Municipality of Princeton (NJ)


