


The District of Columbia is attempting to build a data-based model for the mix of public and "shared" transportation modes on its streets, but is still finding holes in the data necessary to build new policies.
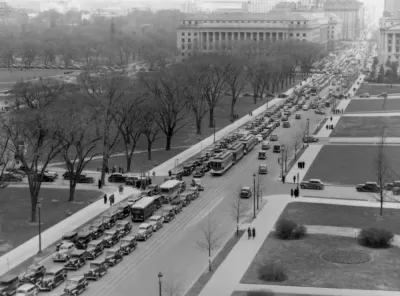
Ride hailing has exploded in the Washington, D.C. market on the same timeline as a steady decline in taxi ridership, according to recently released data.
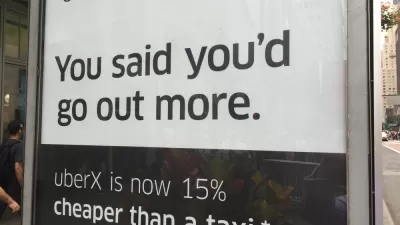
"New figures provided by the office of D.C. Mayor Muriel E. Bowser (D) show that taxi ridership has fallen 31 percent, or about 6 million trips, since the ride-hailing boom began in late 2015," reports Faiz Siddiqui. A ride-hailing surcharge is already generating as much funding as taxis did in 2015, showing further evidence of steady growth in ride-hailing services.
The increased use of ride-hailing also explains why Mayor Bowser has targeted the industry for increased taxes—beyond the 1 percent surcharge currently in place to 4.75 percent.
For context, Siddiqui notes the multiple studies in recent months that tie ride-hailing adoption to increased congestion and decreased transit ridership. But the real story is about the District's efforts to set transportation policy while also working to fill the holes in the available data about how people are traveling its streets. While programs like Uber Movement and SharedStreets (check out Coord for a non-Uber example of curb data platforms) have helped to some extent, the District and other cities around the country still lack a lot of information about average fares and total trips.
FULL STORY: As ride hailing booms in D.C., it’s not just eating into the taxi market — it’s increasing vehicle trips

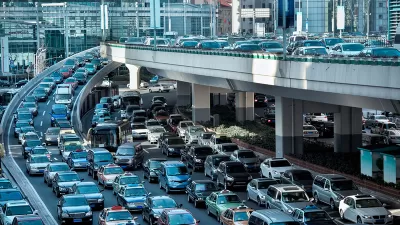
How Much of Traffic is Created by Uber and Lyft?
New data from Fehr & Peers shows services like Uber and Lyft account for a larger share of the total traffic than previously thought, especially in city centers.
Report: Ride-Hailing Drastically Increases Vehicle Miles Traveled
New research published in Transport Policy finds that ride-hailing companies increase vehicle miles traveled of users by 97 percent in Chicago, 114 percent in New York City, and 118 percent in San Francisco.

Ride-Hailing Industry Induces Car Ownership, Research Says
New research from researchers at Carnegie Mellon University finds that instead of setting people free from cars, more people are buying and using cars than ever before.

Planetizen Federal Action Tracker
A weekly monitor of how Trump’s orders and actions are impacting planners and planning in America.

Congressman Proposes Bill to Rename DC Metro “Trump Train”
The Make Autorail Great Again Act would withhold federal funding to the system until the Washington Metropolitan Area Transit Authority (WMATA), rebrands as the Washington Metropolitan Authority for Greater Access (WMAGA).

DARTSpace Platform Streamlines Dallas TOD Application Process
The Dallas transit agency hopes a shorter permitting timeline will boost transit-oriented development around rail stations.

Renters Now Outnumber Homeowners in Over 200 US Suburbs
High housing costs in city centers and the new-found flexibility offered by remote work are pushing more renters to suburban areas.

The Tiny, Adorable $7,000 Car Turning Japan Onto EVs
The single seat Mibot charges from a regular plug in about as much time as an iPad, and is about half the price of an average EV.

Supreme Court Ruling in Pipeline Case Guts Federal Environmental Law
The decision limits the scope of a federal law that mandates extensive environmental impact reviews of energy, infrastructure, and transportation projects.
Urban Design for Planners 1: Software Tools
This six-course series explores essential urban design concepts using open source software and equips planners with the tools they need to participate fully in the urban design process.
Planning for Universal Design
Learn the tools for implementing Universal Design in planning regulations.
Roanoke Valley-Alleghany Regional Commission
City of Mt Shasta
City of Camden Redevelopment Agency
City of Astoria
Transportation Research & Education Center (TREC) at Portland State University
US High Speed Rail Association
City of Camden Redevelopment Agency
Municipality of Princeton (NJ)