


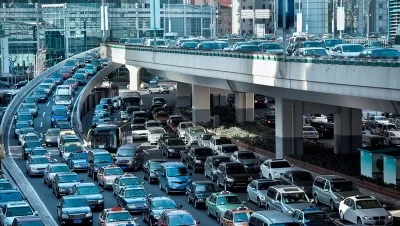
New data from Fehr & Peers shows services like Uber and Lyft account for a larger share of the total traffic than previously thought, especially in city centers.
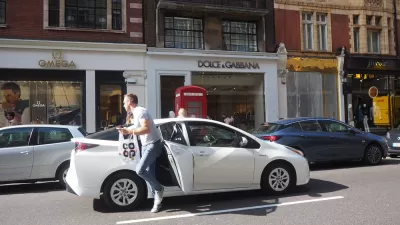
In Boston’s Suffolk County about 1 in every 13 miles driven is driven for Uber or Lyft.
That’s just one of a slew of interesting pieces of information released by Fehr & Peers on how many miles ride-hailing cars travel. Vehicle miles traveled, or VMT, have been climbing in the United States since the economic recession of 2008. Many things have changed since then in the world of transportation, including the arrival and growth of ride-hailing services. This upward trend in miles traveled has meant an upward trend in vehicle emissions, including those that contribute to climate change. Initially there was some hope that ride hailing might actually curb VMT (a hope ride sharing companies were eager to promote), but this study (among others) shows that that has not happened.
The study shows the percent of VMT from ride-hailing companies for cities like Boston (8.5%), San Francisco (13.4%), and Washington D.C. (7.2%). "These numbers suggest that ride-hailing is hitting traffic harder in many cities than previously understood," Laura Bliss writes for CityLab.
Data also shows that the traffic is most concentrated in regions that are well served by public transit. In some cases, a Lyft or Uber ride may entail more VMT than would a private vehicle—as much of the distance these vehicles travel is without a passenger. "On average, between the six cities, just 54 to 62 percent of the vehicle miles traveled by Lyfts and Ubers were with a rider in tow," Bliss reports.
FULL STORY: How Much Traffic Do Uber and Lyft Cause?

Report: Ride-Hailing Drastically Increases Vehicle Miles Traveled
New research published in Transport Policy finds that ride-hailing companies increase vehicle miles traveled of users by 97 percent in Chicago, 114 percent in New York City, and 118 percent in San Francisco.
Uber and Lyft Reveal Seattle-Area Trip Data
After a court battle, the two big transportation network companies finally released trip data, revealing rapid growth and a concentration of rides in the city's most congested areas.

Chicago Could Be Next to Cap Number of Ride-Hailing Vehicles
After New York City approved a similar law earlier in Agust, two Chicago alderman have proposed a law that would limit the number of vehicles operating for transportation network companies like Uber and Lyft.

Planetizen Federal Action Tracker
A weekly monitor of how Trump’s orders and actions are impacting planners and planning in America.

Chicago’s Ghost Rails
Just beneath the surface of the modern city lie the remnants of its expansive early 20th-century streetcar system.
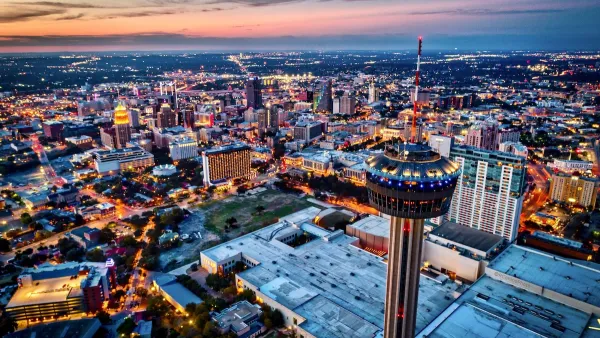
San Antonio and Austin are Fusing Into one Massive Megaregion
The region spanning the two central Texas cities is growing fast, posing challenges for local infrastructure and water supplies.

Since Zion's Shuttles Went Electric “The Smog is Gone”
Visitors to Zion National Park can enjoy the canyon via the nation’s first fully electric park shuttle system.

Trump Distributing DOT Safety Funds at 1/10 Rate of Biden
Funds for Safe Streets and other transportation safety and equity programs are being held up by administrative reviews and conflicts with the Trump administration’s priorities.

German Cities Subsidize Taxis for Women Amid Wave of Violence
Free or low-cost taxi rides can help women navigate cities more safely, but critics say the programs don't address the root causes of violence against women.
Urban Design for Planners 1: Software Tools
This six-course series explores essential urban design concepts using open source software and equips planners with the tools they need to participate fully in the urban design process.
Planning for Universal Design
Learn the tools for implementing Universal Design in planning regulations.
planning NEXT
Appalachian Highlands Housing Partners
Mpact (founded as Rail~Volution)
City of Camden Redevelopment Agency
City of Astoria
City of Portland
City of Laramie