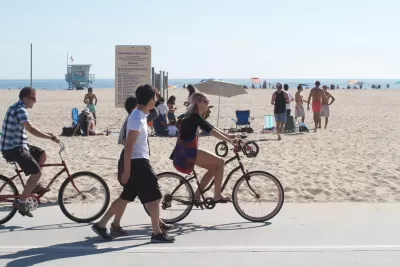
The lead editorial in the December issue of American Journal of Public Health provides the introduction for two research papers on the relationship between bicycling safety and infrastructure expansion in Boston and Vision Zero in U.S. and Sweden.

American cities that have adopted Vision Zero goals for walking and biking have their work cut out. Compared to other advanced nations, it's undeniable that cycling in the United States is less safe.
According to a study last year by the Centers for Disease Control and Prevention, deaths and injuries, associated with an increase in bicycling activity, have risen among older Americans, just as a reduction in juvenile deaths is related to a reduction in that group's cycling.
What's more, some studies have inferred blame lies with cyclists themselves, e.g., cyclists failing to use bike lights and helmets.
Thus, it's refreshing to read what urban planners have to report on this critical topic in next month's issue of the American Journal of Public Health. As many cyclists and planners know, while the use of bike lights, helmets, and reflective clothing is important, it is the design of cycling facilities that is paramount.
"Traffic safety experts now use the term 'crashes' instead of 'accidents' to emphasize that the design of the transportation system contributes to most traffic fatalities and injuries," write John Pucher, Professor Emeritus, Urban Planning, Rutgers University and Ralph Buehler, Professor of Urban Affairs & Planning, Virginia Tech. The two present hard data that may lead some ardent cyclists to consider migrating abroad.
Controlling for exposure levels, cyclist fatalities in 2010 per 100 million kilometers cycled were 4.7 in the United States versus 1.0 in the Netherlands, 1.1 in Denmark, and 1.3 in Germany.1
The editorial introduces two full-length research articles in the Dec 2016 issue of AJPH focusing on cycling safety that are fully accessible:
- AJPH Research: Bicycle Use and Cyclist Safety Following Boston’s Bicycle Infrastructure Expansion, 2009–2012, December 2016
- AJPH Research: Vision Zero in the United States Versus Sweden: Infrastructure Improvement for Cycling Safety, December 2016
Pucher and Buehler present detailed data on trends in cycling safety for 10 cities, looking at the relationship between the increase in bike lane miles, bicycle trips, crashes, and fatalities and injuries between 2000 and 2015.
TABLE 1— Better Bicycle Infrastructure, Improved Cyclist Safety, and Increased Cycling
| City | Years | Growth in Bikeway Network,a % | Growth in Bicycle Trips, % | Change in Crashes per 100 000 Trips, % | Change in Fatalities and Severe Injuries per 100 000 Trips,% |
| Portland, OR | 2000–2015 | 53 | 391 | −62 | −72 |
| Washington, DC | 2000–2015 | 101 | 384 | −46 | −50 |
| New York, NY | 2000–2015 | 381 | 207 | NA | −72 |
| Minneapolis, MN | 2000–2015 | 113 | 203 | −75 | −79 |
| San Francisco, CA | 2000–2015 | 172 | 167 | −36 | NA |
| Cambridge, MA | 2000–2015 | 27 | 134 | −57 | NA |
| Chicago, IL | 2005–2015 | 135 | 167 | −54 | −60 |
| Seattle, WA | 2005–2015 | 236 | 123 | −25 | −53 |
| Los Angeles, CA | 2005–2015 | 130 | 114 | NA | −43 |
| Philadelphia, PA | 2008–2015 | 17 | 51 | NA |
Courtesy of American Journal of Public Health
Like the National Safety Council, research is based on data provided by the Centers for Disease Control and Prevention, particularly from their injury statistics website, WISQARS, which indicates that in 2014, there were 902 cyclist fatalities and 35 206 serious cyclist injuries (requiring hospitalization).
Planetizen also posts traffic fatality reports from the National Highway Traffic Safety Administration (NHTSA) which uses the Fatality Analysis Reporting System (FARS) run by the U.S. Department of Transportation.
Hat tip to John Holtzclaw
Correspondent's notes on related Planetizen posts:
- Studies on bicycle injuries and fatalities: Journal of the American Medical Association, 1998-2013 (September 2015)
- Bicycle fatalities, 1975–2012, U.S. Centers for Disease Control and Prevention (August 2015)
- Two posts on a controversial GHSA bicycle fatalities report, 2010-2012 (November 2014 and October 2014)
FULL STORY: Safer Cycling Through Improved Infrastructure

Maui's Vacation Rental Debate Turns Ugly
Verbal attacks, misinformation campaigns and fistfights plague a high-stakes debate to convert thousands of vacation rentals into long-term housing.

Planetizen Federal Action Tracker
A weekly monitor of how Trump’s orders and actions are impacting planners and planning in America.

In Urban Planning, AI Prompting Could be the New Design Thinking
Creativity has long been key to great urban design. What if we see AI as our new creative partner?

San Francisco Mayor Backtracks on Homelessness Goal
Mayor Dan Lurie ran on a promise to build 1,500 additional shelter beds in the city, complete with supportive services. Now, his office says they are “shifting strategy” to focus on prevention and mental health treatment.

How Trump's HUD Budget Proposal Would Harm Homelessness Response
Experts say the change to the HUD budget would make it more difficult to identify people who are homeless and connect them with services, and to prevent homelessness.

The Vast Potential of the Right-of-Way
One writer argues that the space between two building faces is the most important element of the built environment.
Urban Design for Planners 1: Software Tools
This six-course series explores essential urban design concepts using open source software and equips planners with the tools they need to participate fully in the urban design process.
Planning for Universal Design
Learn the tools for implementing Universal Design in planning regulations.
Gallatin County Department of Planning & Community Development
Heyer Gruel & Associates PA
JM Goldson LLC
Mpact (founded as Rail~Volution)
City of Camden Redevelopment Agency
City of Astoria
Jefferson Parish Government
Camden Redevelopment Agency
City of Claremont


