


Online misinformation has been unavoidable, but the Internet is also full of tools essential for understanding the changed world of COVID-19.

It isn't premature to declare 2020 the year of the coronavirus. Every prediction made in December and January about the trends that would define this year were wrong—mine included. In 2020, auto manufacturers are making ventilators. Jeans companies are making masks. Public transit is empty, and cars stay at home all day long. The Internet, until recently a platform devoted to the sole purpose of pledging fealty to U.S. presidential candidates, now reads like a 24-hour shopping network for coronavirus hot takes. The world is completely changed, and it's still changing.
The world isn't nearly done with the coronavirus, and every passing day deepens the economic and social crises that have followed the public health crisis. There are still millions of professionals all over the world working harder than ever to defeat this coronavirus and take care of as many people as possible. Planners are no exception. The field of planning can play a prominent role in the recovery from this crisis, but big changes will be necessary in almost every facet of planning practice.
It's possible to hope that planners accustomed to toiling away behind the scenes in their respective city halls might now be liberated from some of the insulation of bureaucracy. The field's new digital grounds might prove fertile for positive innovations, but positive change won't be possible without improved engagement with the public, and better data than ever—the right data to answer the right questions and the right arguments to persuade the masses. Planning outcomes could very well suffer as a result of its newly digitized forums.
The online resources that follow are recommended for student and professional planners, and anyone, really, devoted to defeating the coronavirus and mitigating the worst social, economic, and environmental outcomes still at risk in this crisis. Please, please, please feel free to add other useful examples in comments below, and we will continue updating this list as new tools come to our attention.
The Internet is a novel addition in the history of pandemics. Hopefully the Internet technology leveraged since March in the United States will serve as infrastructure for the inevitable crises of the future. Perhaps, even better, some of this digital infrastructure can be leveraged to make the next crisis, and those to follow, a little less inevitable. The systems of the past have precipitated or prolonged the current crisis. One of the great unknowns of this current crisis will be whether policy fields like planning can deliver on the change necessary to overcome this crisis and prevent worse in the future. Lives have always been at stake. Maybe now we'll act like it.
Housing and the Eviction Crisis
The National Low Income Housing Coalition has provided a steady voice of information and advocacy during the pandemic, tracking the federal government's efforts to provide economic relief in the CARES Act stimulus, and pushing for more effective relief in future stimulus packages. Among the resources available on the NLIHC website is a database of properties protected by the CARES Act eviction moratorium, as well as a page set up to track the closure of homeless shelters by state.
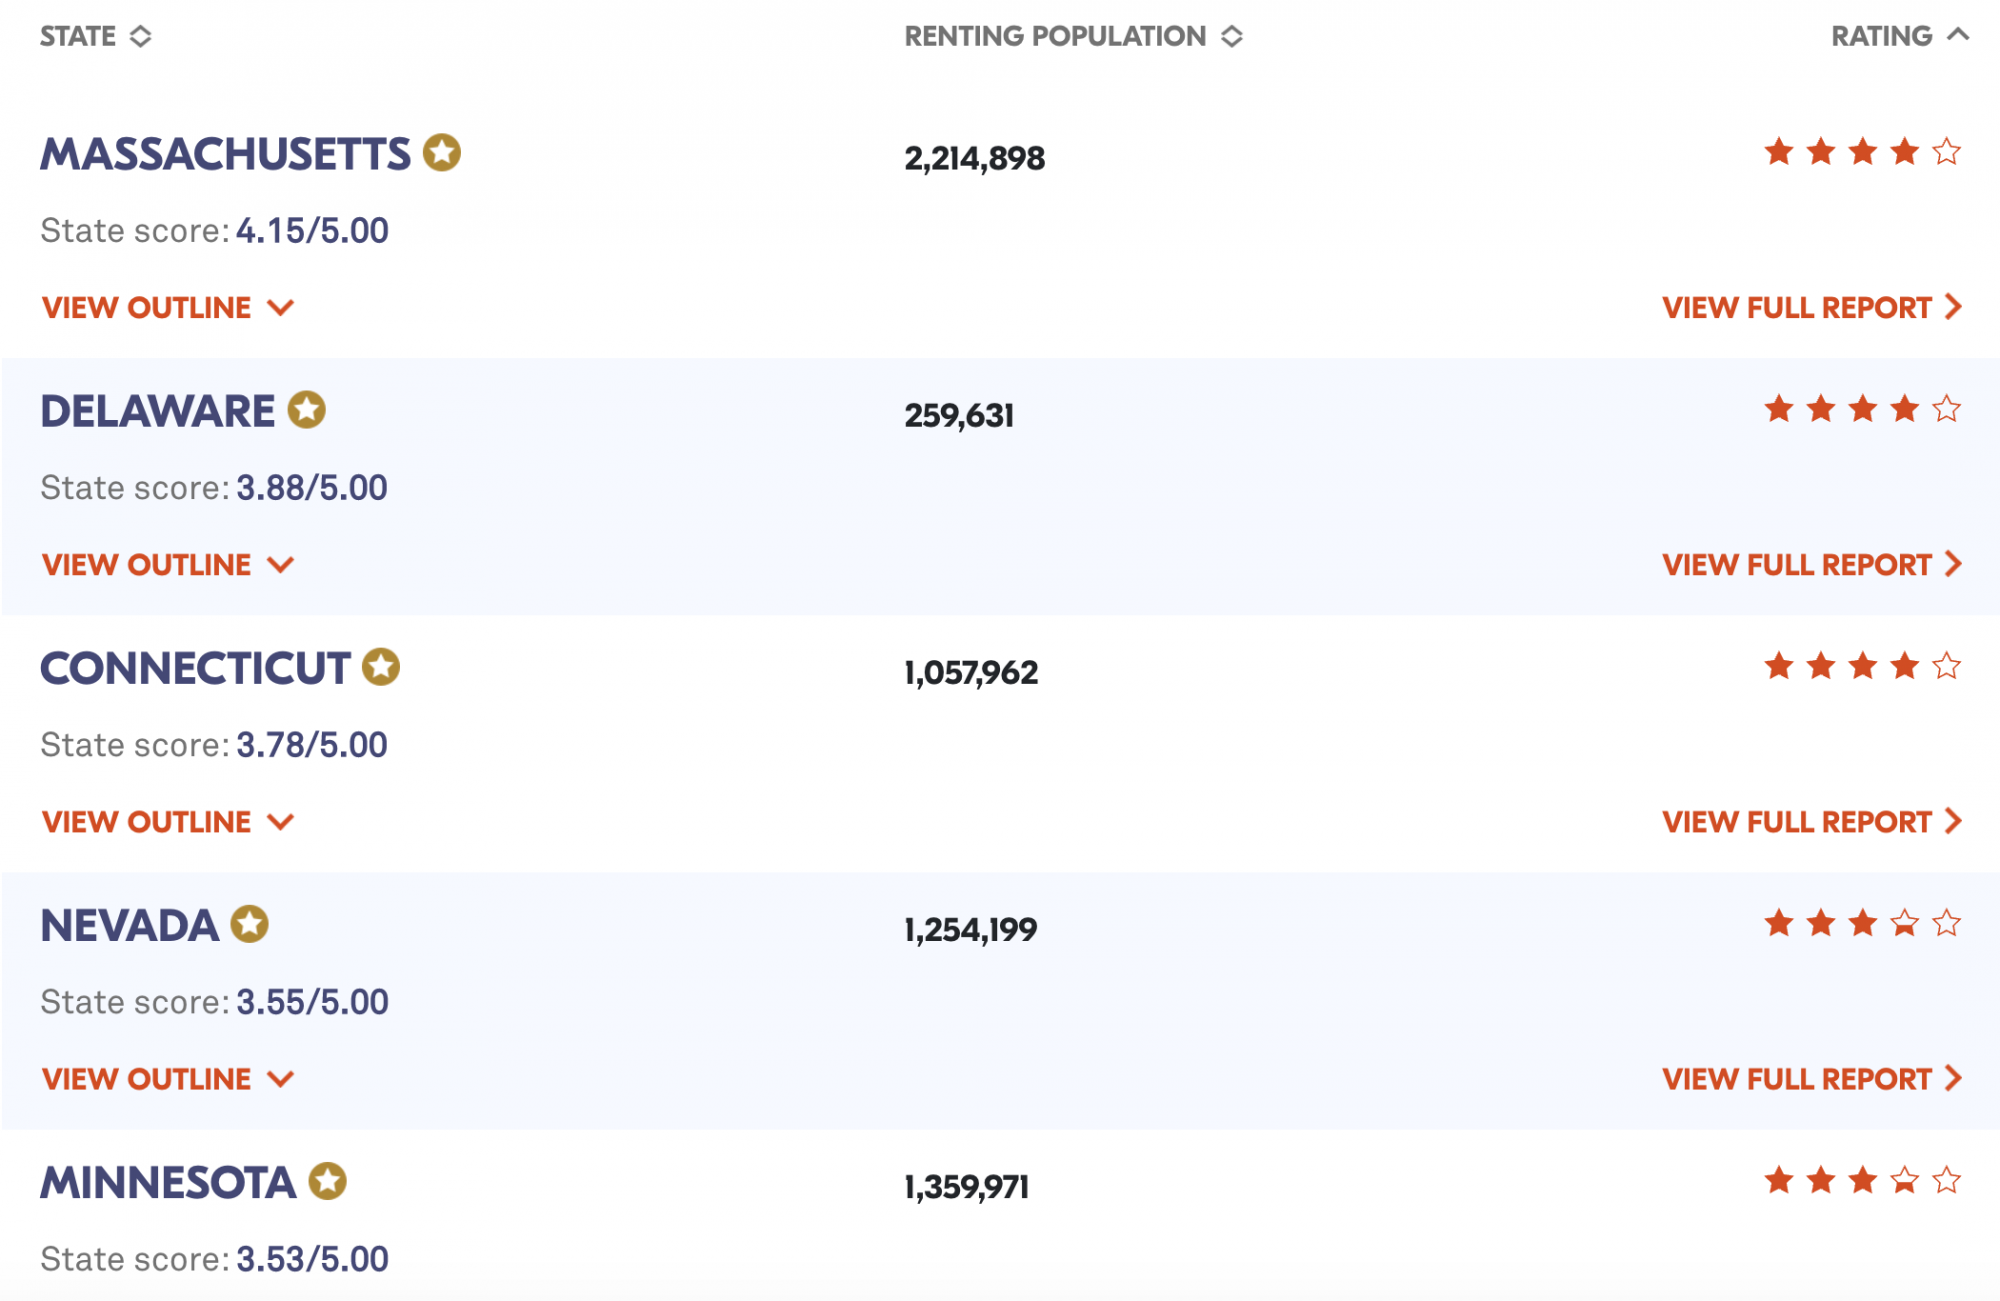
The Eviction Lab at Princeton University, founded by Matthew Desmond, author of Evicted, has set up a Housing Policy Scorecard. Massachusetts leads the nation, according to this scorecard, in providing protections for renters. Bringing up the rear, with a score of zero, are Wyoming, Idaho, Arkansas, North Dakota, South Dakota, and Missouri. Matthew Desmond also did an interview with CityMetric about the eviction crisis connected to the COVID-19 pandemic.
Public Realm and Open Space
Mike Lydon, consultant and co-author of Tactical Urbanism, has created a Google Drive spreadsheet with up-to-date information about the cities opening cars to pedestrian and bike priority. As Americans sheltering in place seek room for exercise and fresh air on increasingly cramped sidewalks, and with far fewer cars on the street, numerous cities have reclaimed street space for active transportation over the course of the pandemic. Philadelphia was first to act, but Minneapolis, Denver, Oakland, and New York City have all thrown their hats into the ring with authority. In practice, the idea is controversial, and not just for drivers. Some voices and organizations in planning have criticized the COVID-19 open streets movement for not considering issues of racial equity. An example of this controversy is playing out in Chicago, where the Active Transportation Alliance, a prominent biking and walking advocacy organization, has resisted open streets plans in that city.
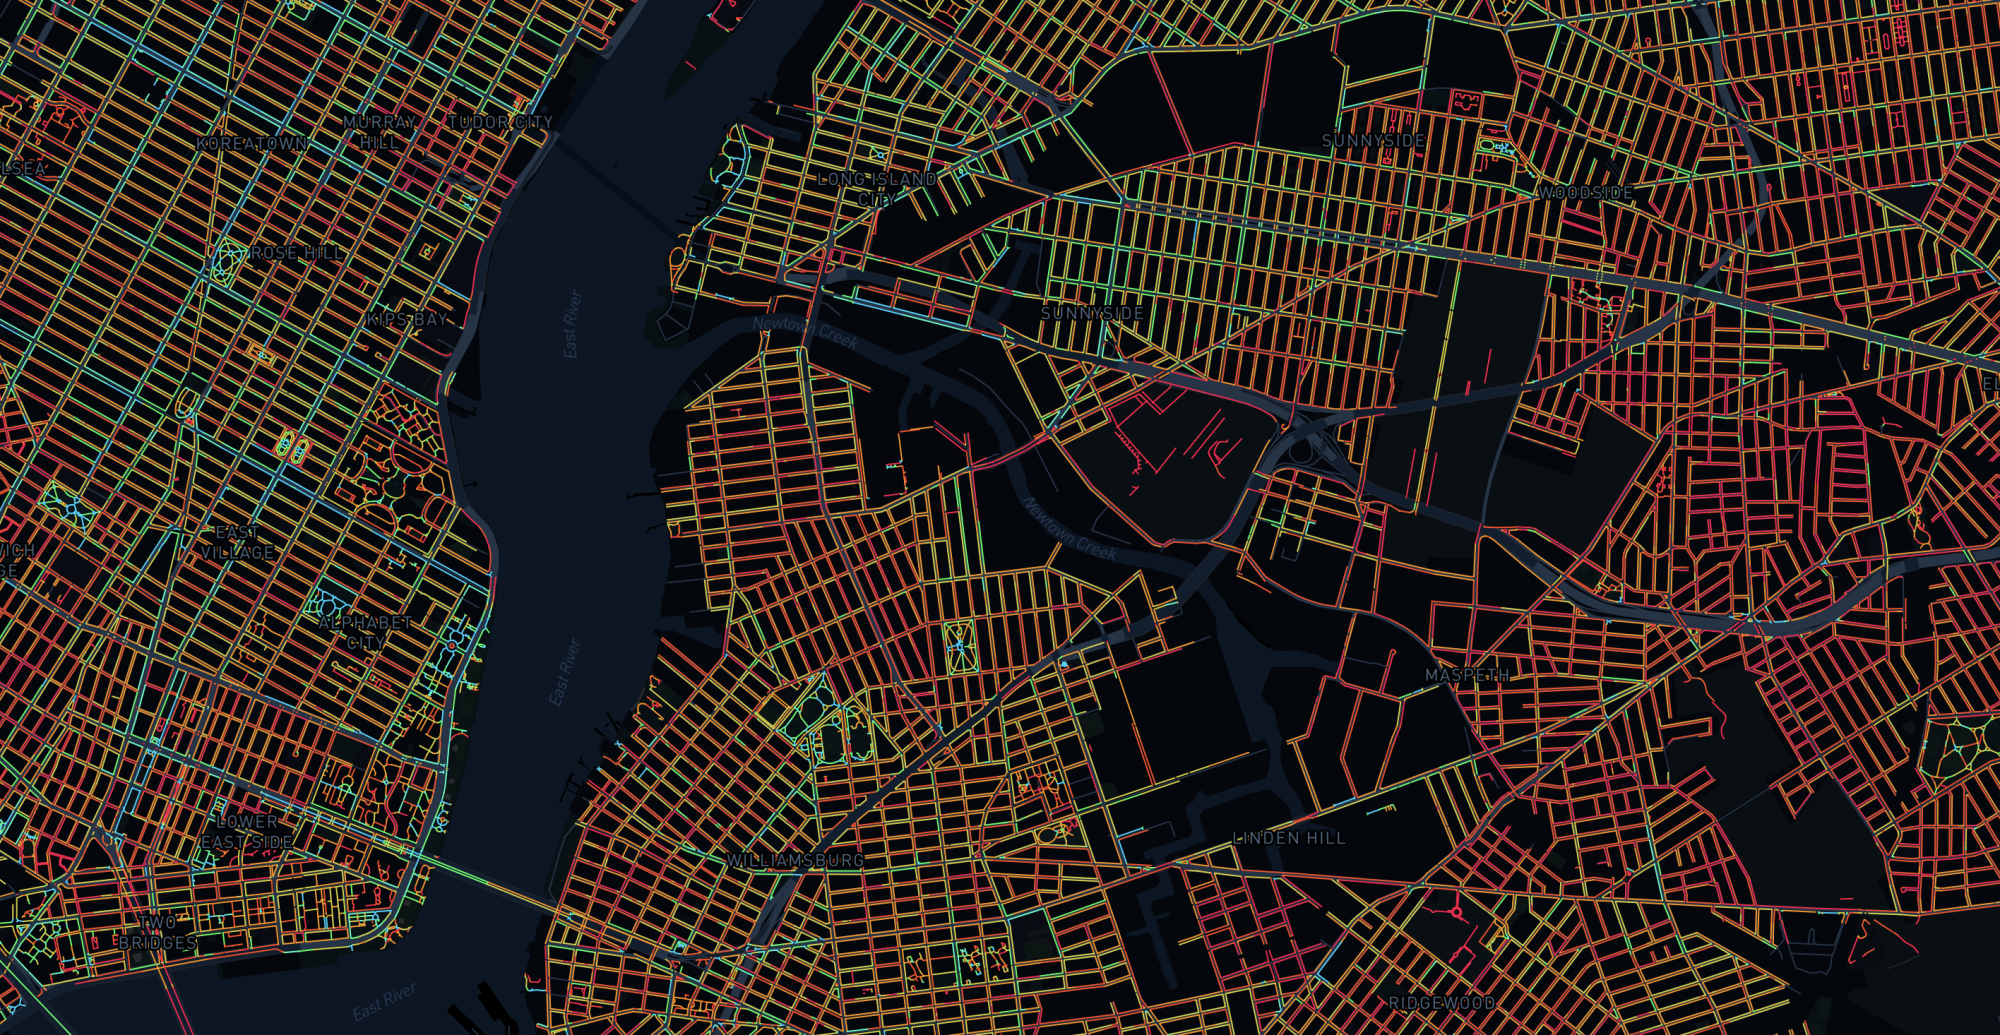
To illustrate the scale of the challenge of accommodating a sudden spike in pedestrians and people on bikes, check out the Sidewalk Widths NYC website, which uses Mapbox to create a custom map of sidewalk widths around New York City. The process of creating the map is documented on GitHub for duplication in other cities.
The New York City Department of Parks and Recreation has shifted its approach during the pandemic to bring some of the beauty and learning of the outdoors direct to the home, offering the Parks@Home initiative that includes virtual tours, remote talks by park rangers, and meditation exercises.
Public Transit and Mobility
One of the first, most obvious shock waves of the pandemic manifested in plummeting ridership and revenues at public transit agencies all over the country. The Transit app, a popular favorite among transit riders and a frequent inclusion on the Planetizen Top Apps post every year, created a website to track the transit demand by time of day. The website also offers links to resources and more information for transit agencies.
The National Association of City Transportation Officials (NACTO) and Bloomberg Philanthropies also launched the Transportation Response Center, a new online platform offering rapid response tools, collaboration opportunities, and information from transportation agencies around the world.
Transit planning consultant Jarret Walker has provided a much-needed voice of support for public transit as the ridership and funding realities have induced an existential crisis for the idea of shared, public modes of transportation in the United States, eloquently defending the essential role of public transit both before and after the pandemic. Walker has also provided guidance on transit service design in a pandemic, which requires tough choices about coverage and frequencies, as exemplified by changes made to transit routes and schedules in San Francisco.
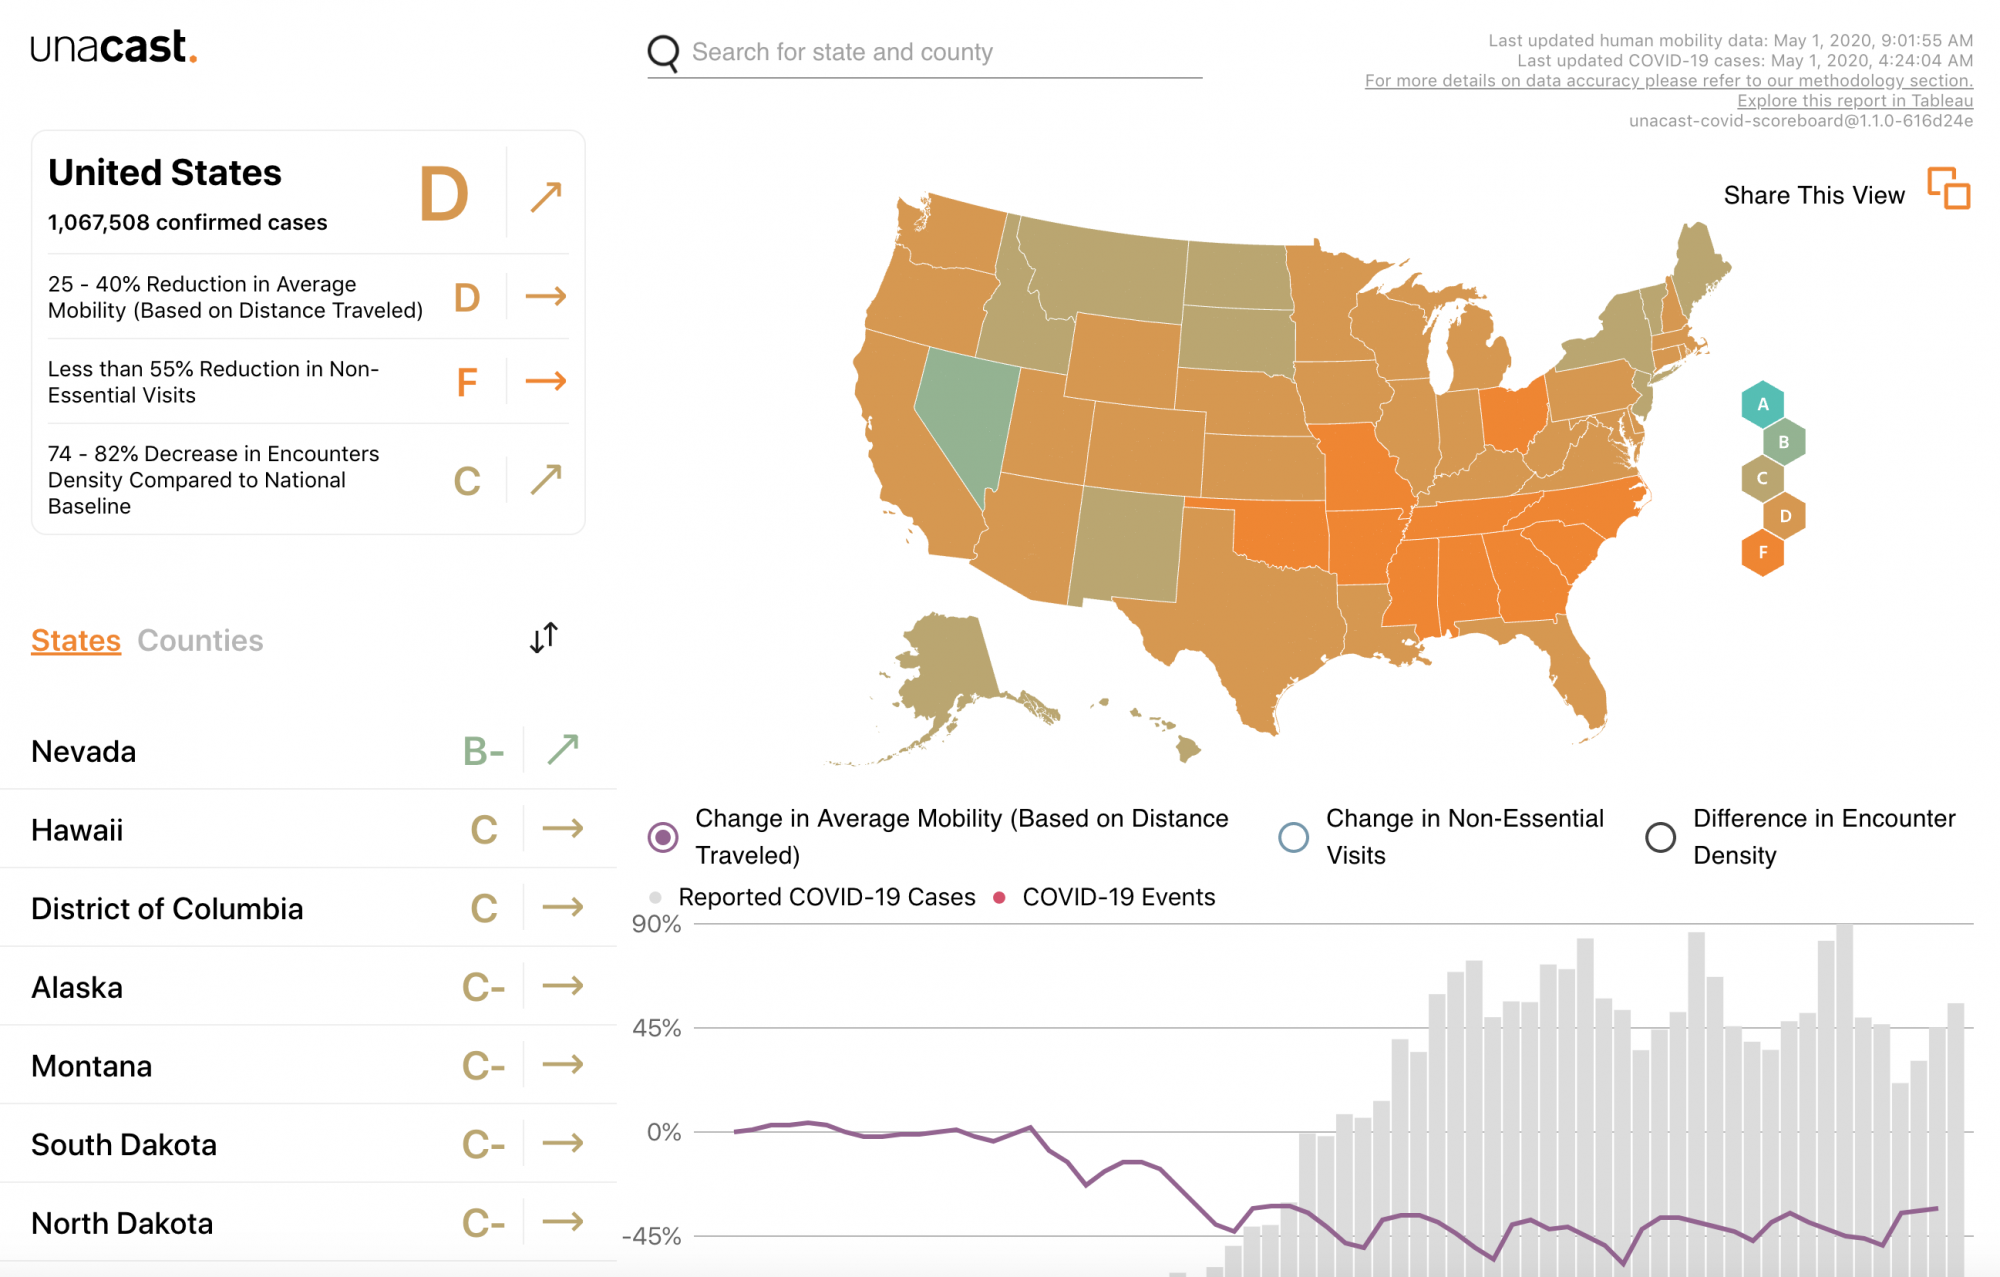
Bus and subway riders aren't the only ones ditching their rides, however. People are just staying home, as evidenced by the controversial use of smart phone data to track movement patterns during shelter-in-place orders. A data software company called Unacast was one of the first to mobilize location data for public consumption with a "Social Distancing Scoreboard," currently showing fewer good scores than it was when Planetizen first picked up the news of the scoreboard in March.
Another way of appreciating the effects of the world's sudden lack of transportation is in the decline of the pollution created by the world's transportation systems. A report by IQAir, published on Earth Day, quantifies the air quality improvements during lockdowns in ten large worldwide cities, including Los Angeles and New York City here in the United States. Edison Trends also tracked the decline of demand for ride-hailing services like Uber and Lyft in March, but hasn't updated the data for public consumption since.
For a high-altitude view of multiple modes of transportation, Apple has created a Mobility Trends Report, measuring demand for mobility by calculating the number of users requesting directions on Apple Maps. As of this writing, Americans are clearly increasing their range as they take the first tentative steps back toward normal.
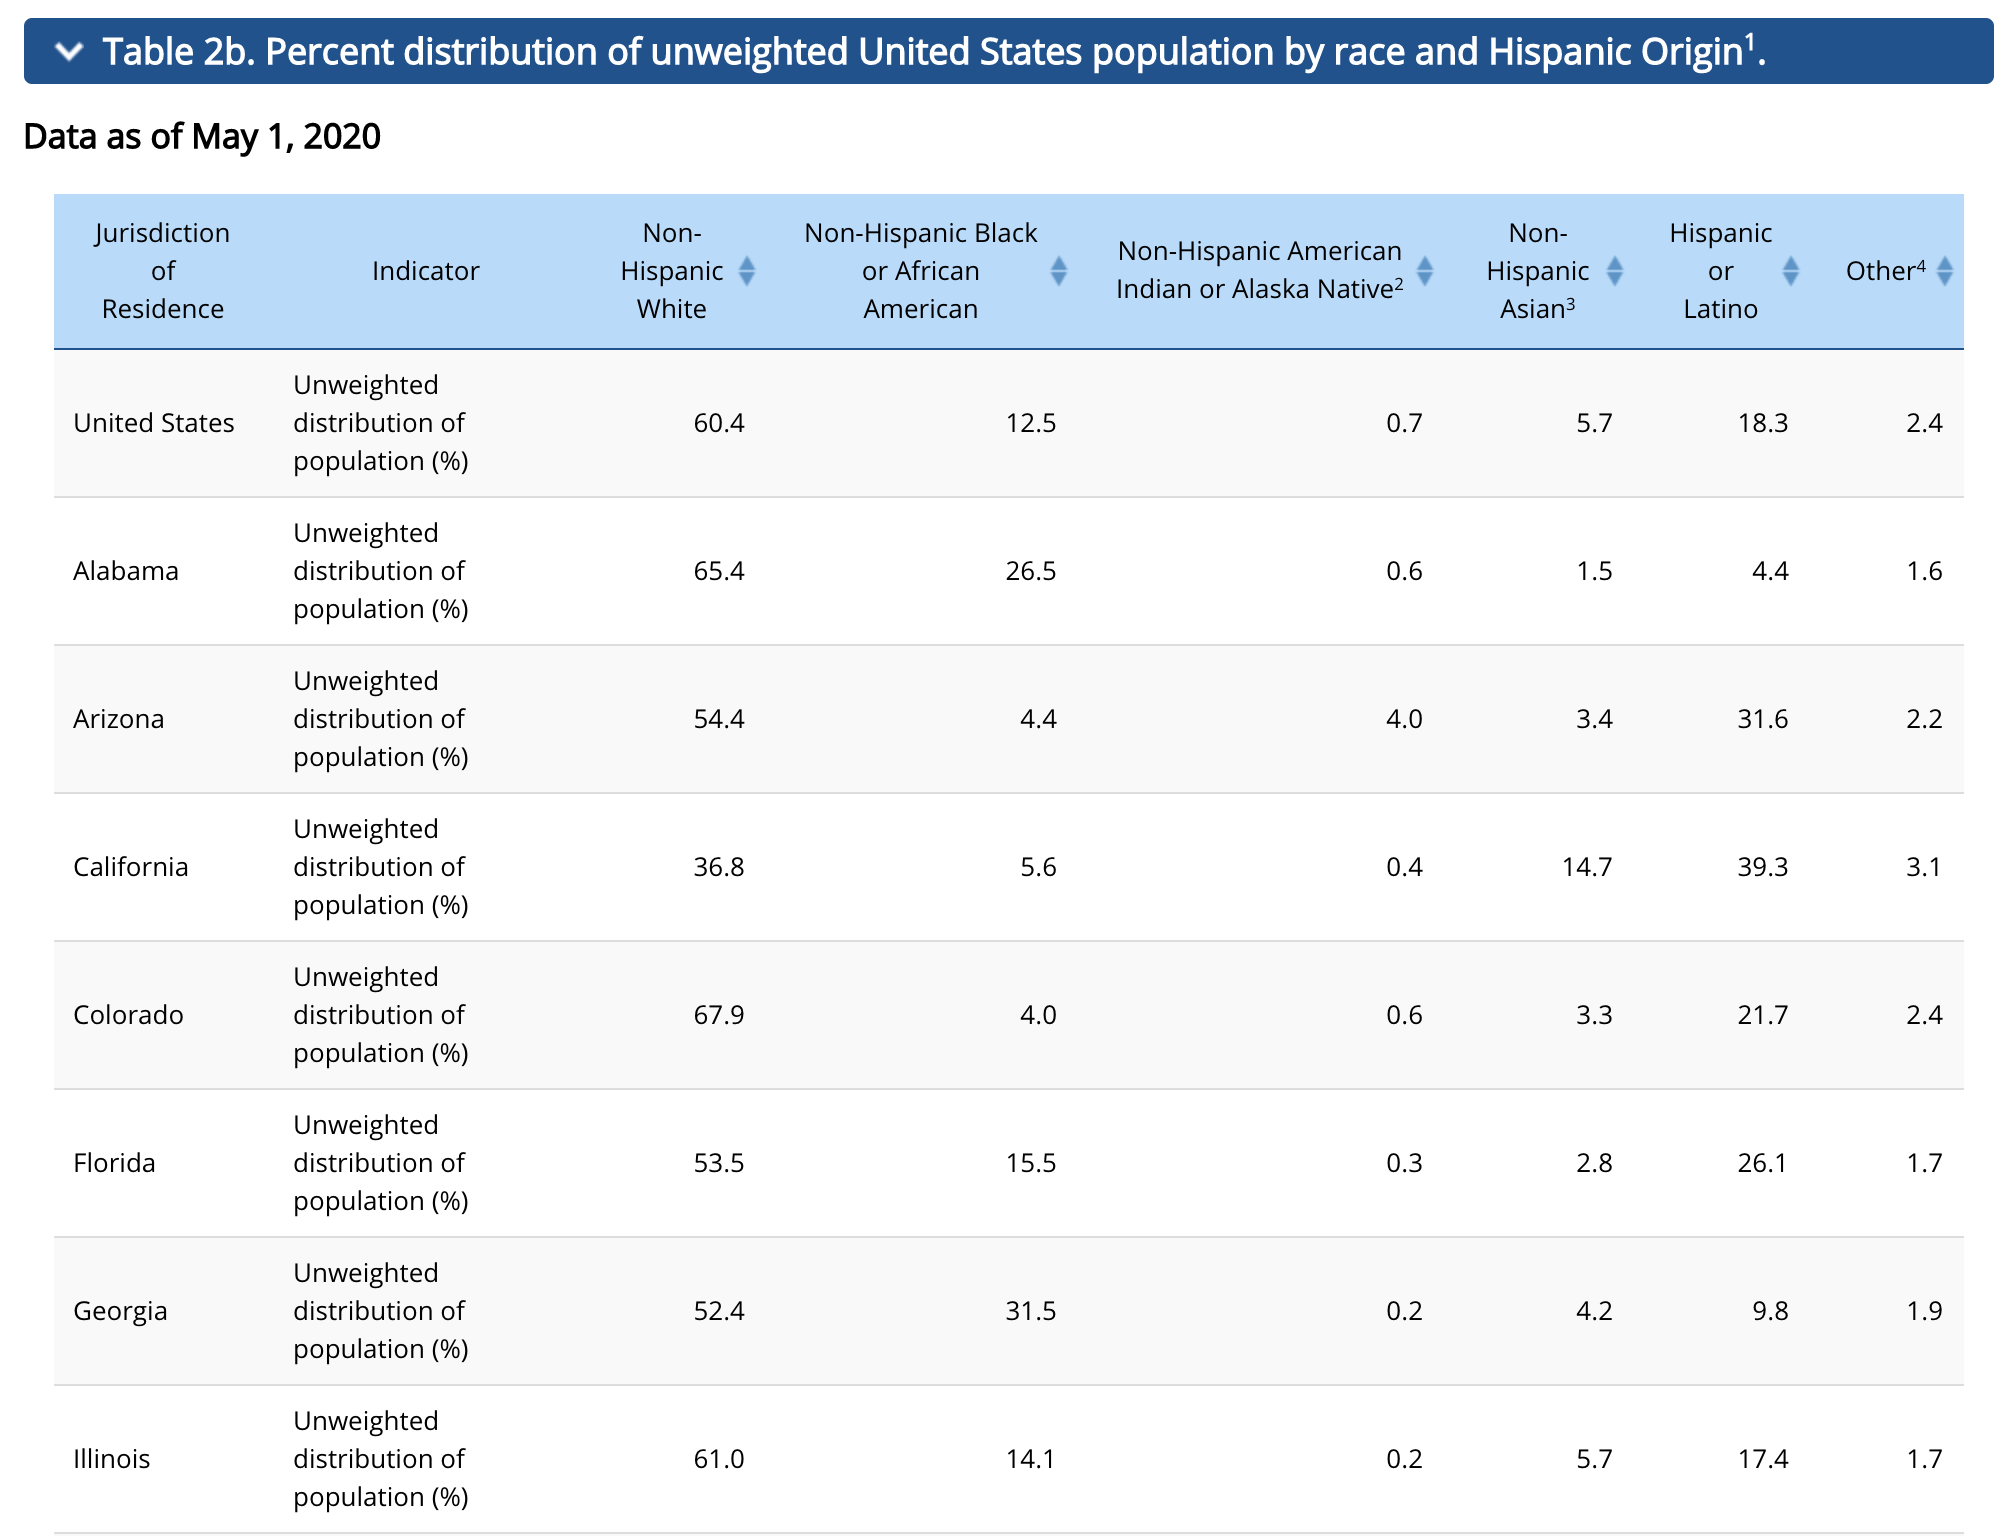
Location data has shown a clear difference in the social distancing experiences by race and income group in the United States, as documented in a bombshell New York Times article published at the beginning of April, a constantly salient point that segues nicely into to the next category of websites.
Demographics and Economic Geography
The Centers for Disease Control started releasing racial demographics for COVID-19 deaths in April, and some states, regions, and cities have followed suit, revealing a tragic disparity in the public health outcomes of the pandemic. The CDC also created an online portal for COVID-19 death data, including demographic categories like age, gender, race, place of death, and provisional county-level data. Johns Hopkins University's COVD-19 tracker also started tracking the progress of states in releasing racial demographic data in April in the Racial Data Transparency map. As of this writing, 34 states are releasing racial data of confirmed COVID-19 cases, and 26 states are releasing racial data about confirmed COVID-19 deaths.
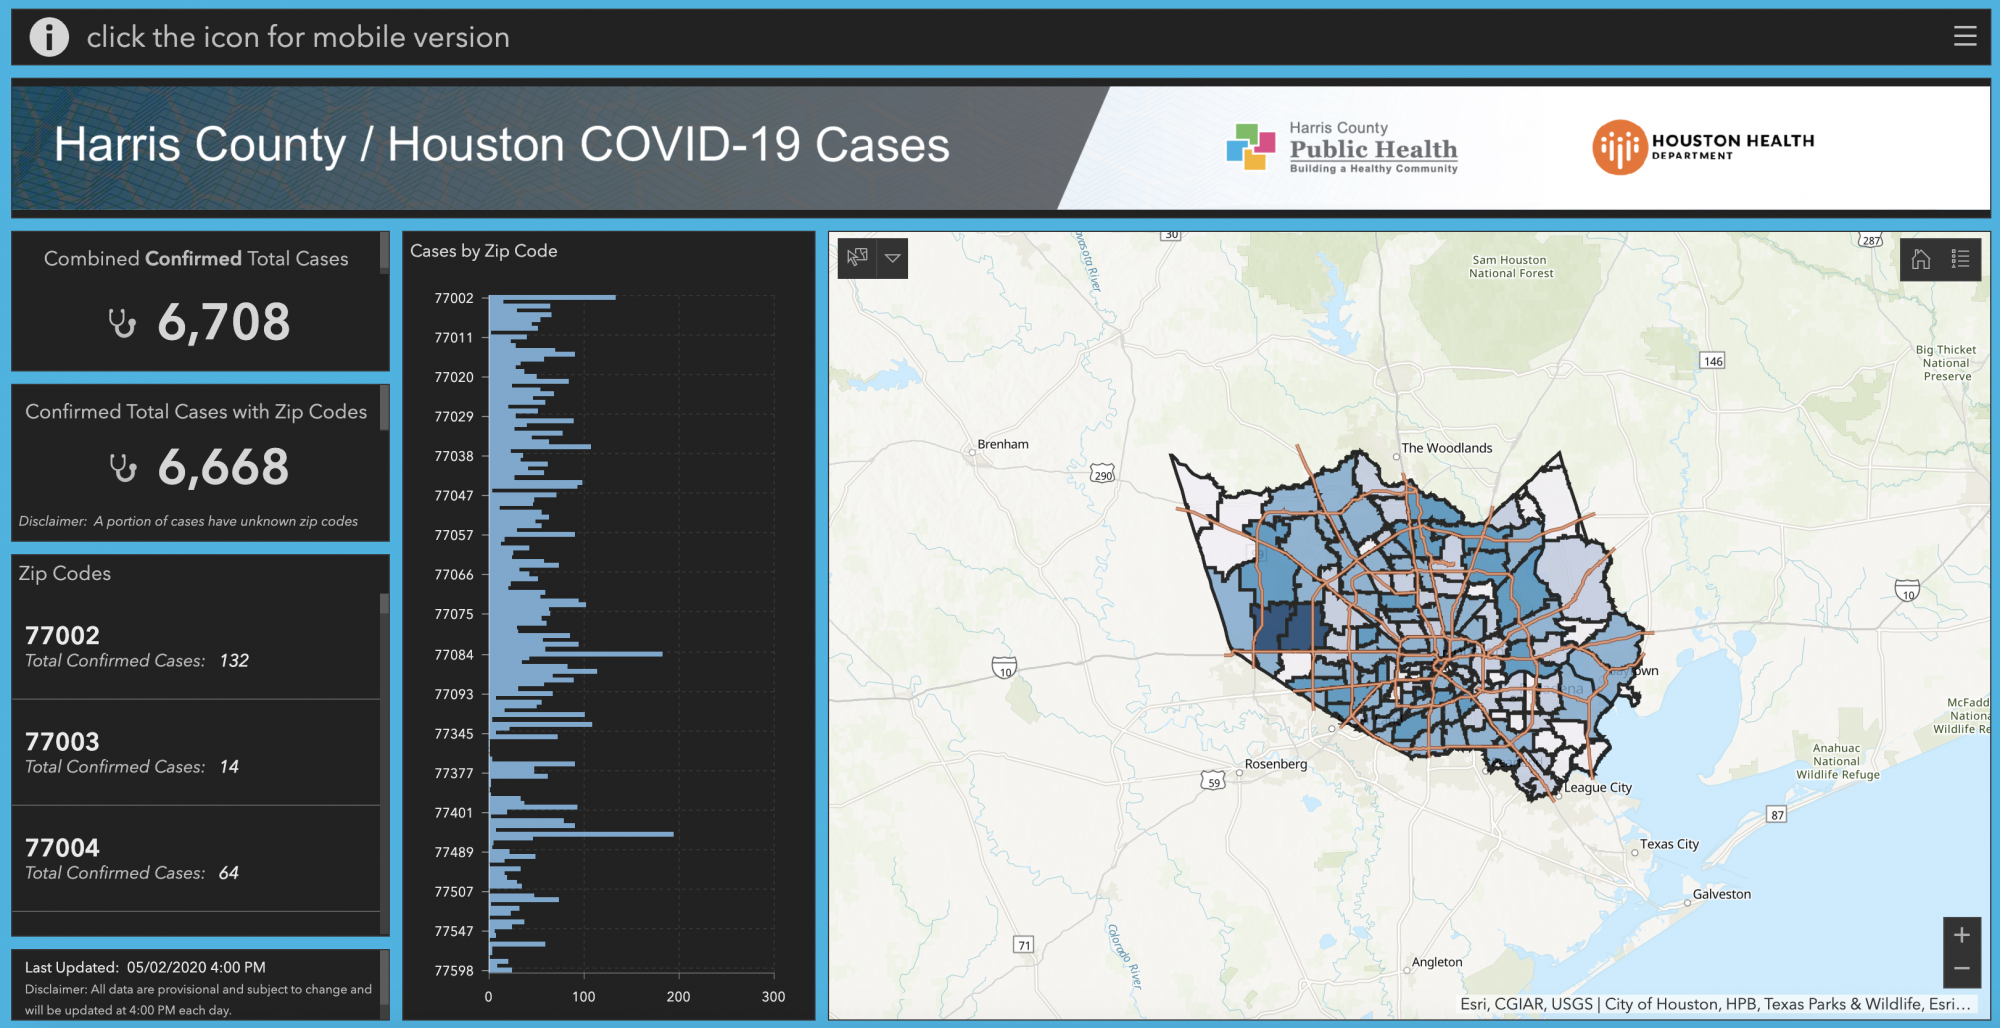
The geography of the economic effects of the pandemic has revealed demographic patterns overlapping with the public health crisis, according to numerous sources, including an article by Jonathan Stiles for Planetizen. The Urban Institute is offering an interactive tool sharing geographic information on job losses. When the Urban Institute last updated this tool on April 24, the highest rates of job losses were found in neighborhoods with a concentration of jobs in the tourism and transportation sectors. Since then, the Kinder Institute for Urban Research at Rice University published a Houston Community Data Connections platform for evaluating job loss data at the zip code level in Harris County.
The future of demographic data, as furthered by the biennial Census process underway around the country this year, has been complicated by the public health concerns of the pandemic, as documented at a Census website devoted to COVID-19 information. After altering its operations plan to delay door-to-door follow ups, the Census Bureau finally requested a delay in data delivery deadlines used to inform congressional redistricting. In the meantime, however, the Census Bureau has set up several new platforms for data related to the effects of the coronavirus, including a Household Pulse Survey, a Small Business Pulse Survey (both provide weekly measures of the impact of the coronavirus pandemic), and a more localized version of the Bureau's Business Formation Statistics.
Professional Planning Practice
The American Planning Association (APA) responded to the pandemic by cancelling its National Planning Conference, scheduled for April in the city of Houston, while reconfiguring the event to be held online, with numerous virtual panels and speakers, wrapping up at the end of last week. The APA has also published two separate lists of resources geared toward planners, including some of the resources listed here. The first list connects to external "information clearinghouses," while the second list connects to APA podcasts, accessible on Soundcloud, articles published in Planning magazine, and other resources created by local and state chapters of the APA. The resources shared on the second list provide resources and guidance on the need to transform the day-to-day operations of professional planning practice, as well as some of the more theoretical considerations about the future of the field as the world changes in response to the pandemic.
Many planning departments around the country are moving quickly to sanitize the operations of public planning processes. The response has not been consistent, however, as some planning departments have shut down public facing processes entirely, while others are finding ways to continue public engagement and project approval processes via digital means. Seattle, one of the first cities to suffer the public health and economic outcomes of COVID-19, approved a new digital design review process in April.
The American Institute of Architects has been providing similar guidance about professional practice to the architecture industry, a professional field in a closely knit economic relationship with planning. As the need for architecture services goes, so goes the need for planning. Along the same lines, the construction industry is also figuring out how to operate under social distancing guidelines. AECOM even created a virtual meeting platform to host public project discussions.
Government Cooperation
In an absence of federal leadership, much of the policy response to the outbreak of the pandemic has occurred at the state, regional, and local level. Numerous new online platforms disseminate information and encourage collaboration between governments, especially at the local level. Collaboration platforms created by the International City/County Management Association (ICMA), the National League of Cities in partnership with Bloomberg Philanthropies, and the Smart Cities Council offer examples. Bloomberg Philanthropies also worked partnered with Johns Hopkins Bloomberg School of Public Health and the Bloomberg Harvard City Leadership Initiative to create the COVID-19 Local Response Initiative.
[Update: the U.S. Conference of Mayors has released a "Fiscal Pain Tracker" to raise awareness about the draconian budget measures necessary if the federal government doesn't send large-scale relief to local governments.]
[Update: The Greater Ohio Policy Center has created a "COVID-19 Relief Programs in Ohio" platform, with resources and information on housing and evictions, foreclosures, utilities, unemployment, transit assistance, nonprofit assistance, city and community programs, and more.
Federal leadership hasn't been completely absent, however, although the effectiveness of the CARES Act, the most tangible form of crisis response from Congress and the Trump administration so far, will likely be debated for a period lasting much longer than our lifetimes. The American Planning Association offers advice for turning that federal crisis funding into local crisis action, with guidance about the kinds of funding available under the CARES Act.
Planning for Public Health
At the root of all of these various online platforms is the same goal to reduce the public health risks presented by the coronavirus. Never before have the intersections between the planning and public health fields been so obvious, or so obviously consequential. A partnership between ProPublica and Harvard Global health Institute created a data visualization for that frontline concern in March, mapping out hospital capacity relative to potential infection rates.
The Center for Systems Science and Engineering at Johns Hopkins University used ArcGIS to create the Coronavirus COVID-19 Global Cases dashboard, probably the data visualization platform most commonly referenced throughout the pandemic, tracking the number of coronavirus in every country in the world, as well as deaths, recoveries, and tests. The Biocomplexity Institute at the University of Virginia also used ArcGIS to create the COVID-19 Surveillance Dashboard, which provides a different approach to the same kinds of data. Esri launched a COVID-19 GIS hub, and built a modeling system for automating ideal locations for testing facilities using ArcGIS Pro and ModelBuilder with the help of the Business Analyst and Network Analyst extensions. [Update: Esri on May 7 announced the launch of a free COVID-19 Response Package for all nonprofit organizations responding to the pandemic.]
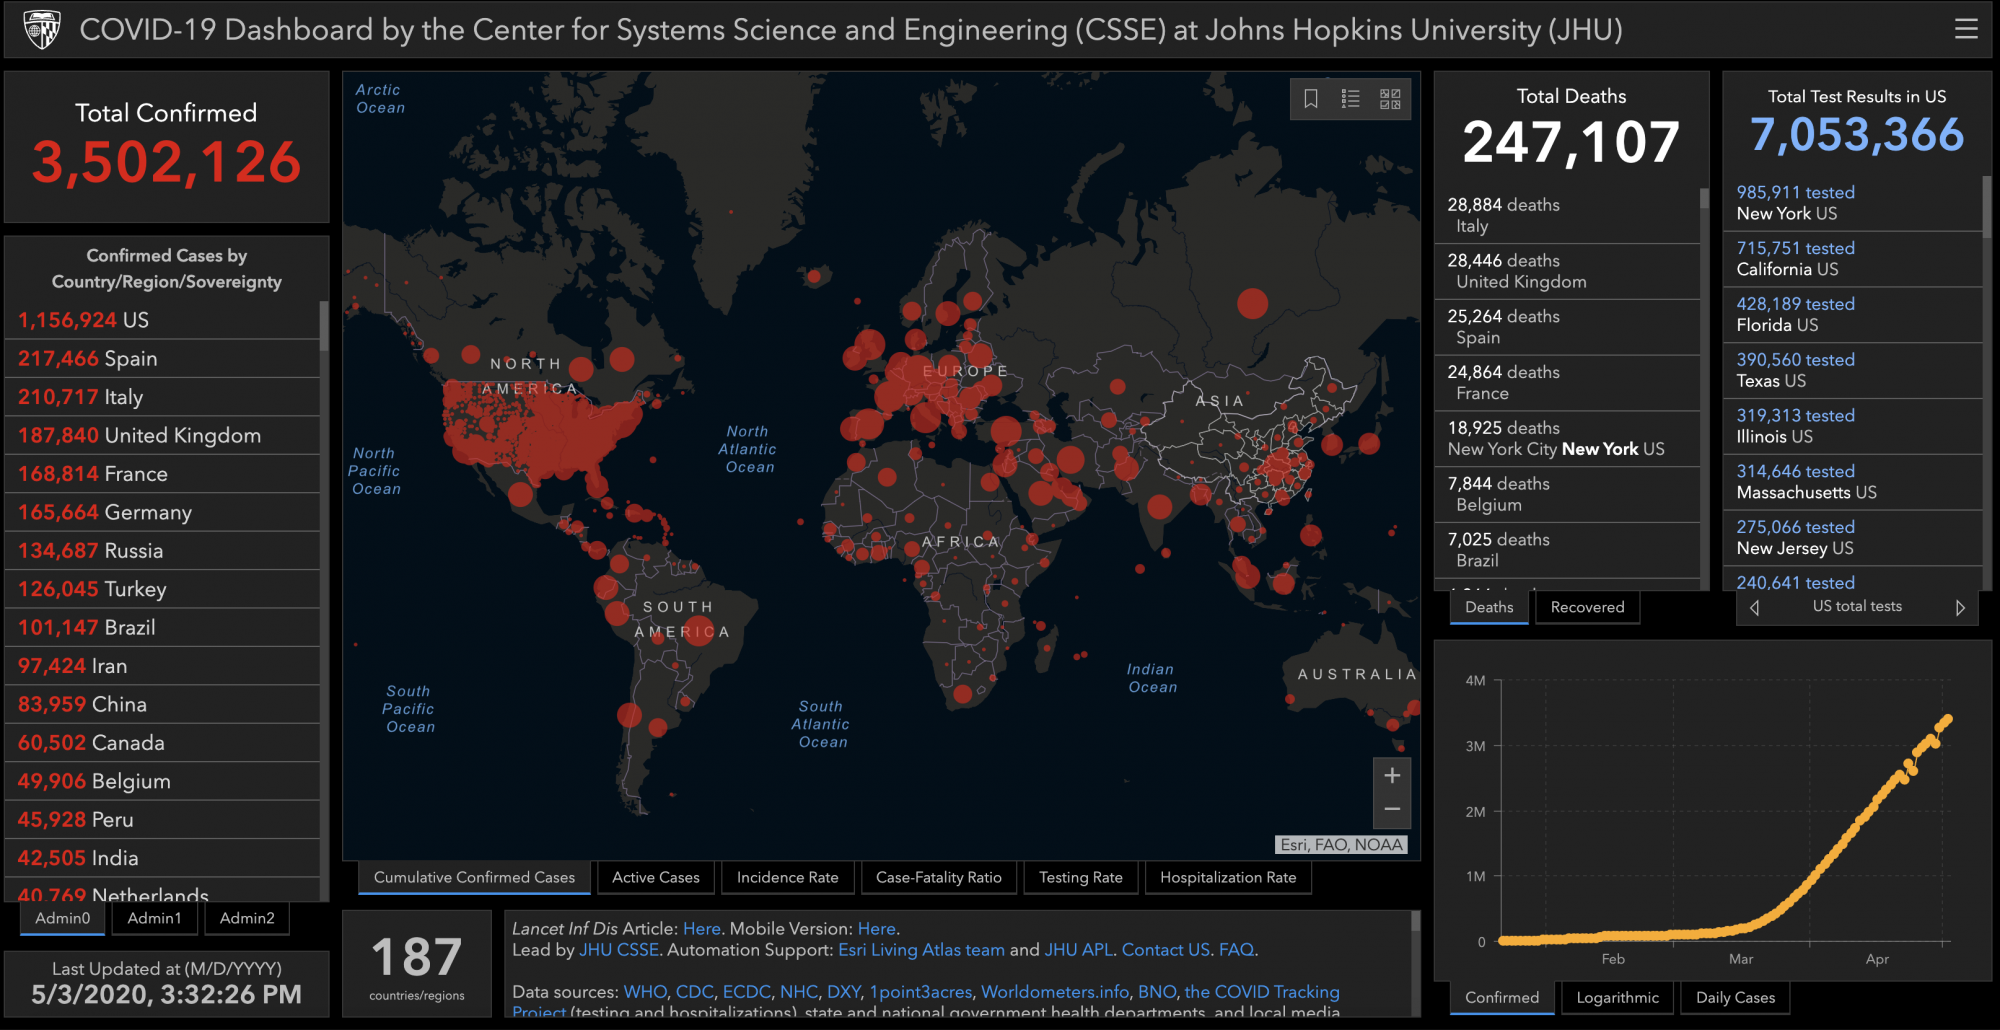
Coronavirus COVID-19 Global Cases (Center for Systems Science and Engineering at Johns Hopkins University)
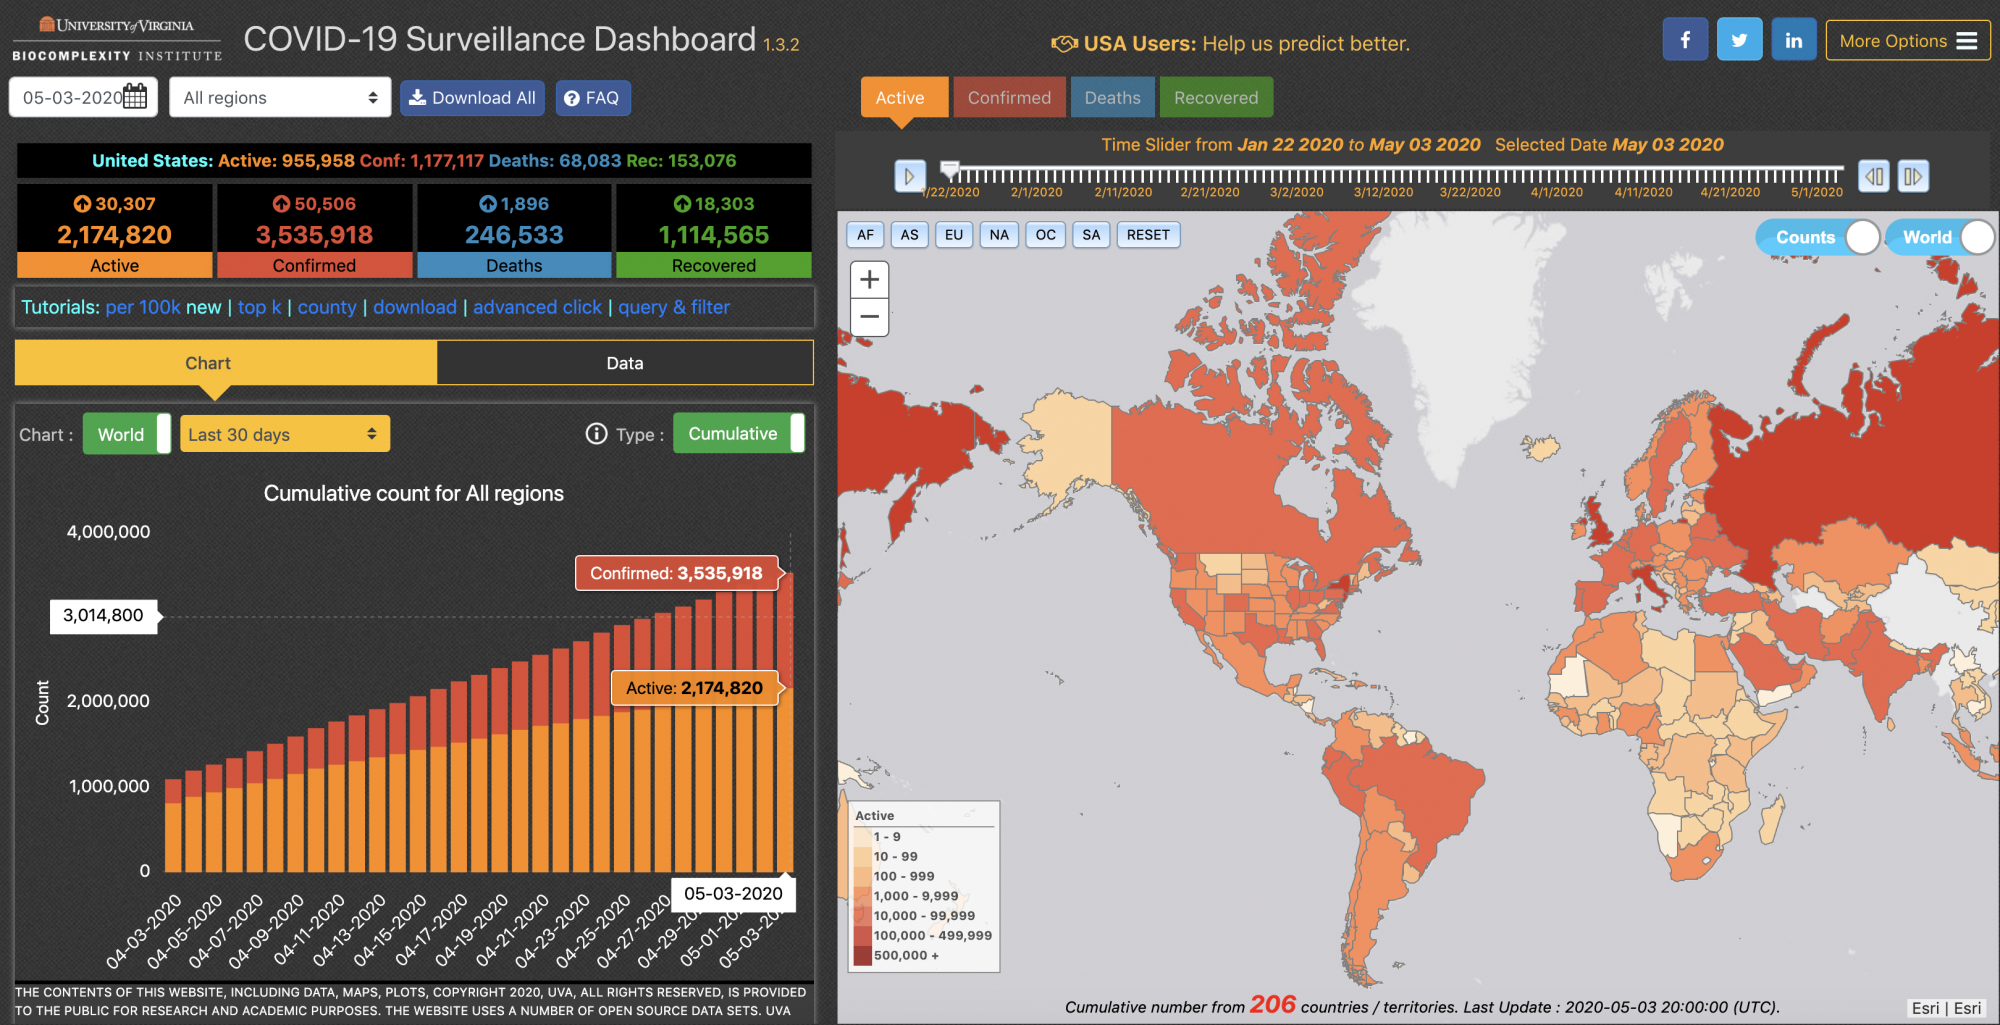
COVID-19 Surveillance Dashboard (Biocomplexity Institute at the University of Virginia)
Finally, a list of webinars curated by the Overhead Wire offers a full menu of planned events that promise to motivate informed responses to the crisis. The calendar this week already includes a lot of opportunities for education and engagement.

Top Websites for Urban Planning – 2020
Planetizen's annual list of the best of the planning Internet in a year inextricably defined by the uncertainty and constraints of the COVID-19 pandemic.

Announcing an Antidote for Planning Uncertainty: A Pandemic Tool Kit for Local Governments
A new toolkit shares 22 actions governments should take to get the economy restarted, including the regulatory or policy tools needed to implement the actions.
'Metro Recovery Index' Measures the Impact of the Pandemic and the Trajectory of the Recovery
Brookings has released a new tool for measuring the impact of the coronavirus on local economies across the country, as well as the effectiveness of economic recovery efforts.

Planetizen Federal Action Tracker
A weekly monitor of how Trump’s orders and actions are impacting planners and planning in America.

Chicago’s Ghost Rails
Just beneath the surface of the modern city lie the remnants of its expansive early 20th-century streetcar system.

San Antonio and Austin are Fusing Into one Massive Megaregion
The region spanning the two central Texas cities is growing fast, posing challenges for local infrastructure and water supplies.

Since Zion's Shuttles Went Electric “The Smog is Gone”
Visitors to Zion National Park can enjoy the canyon via the nation’s first fully electric park shuttle system.

Trump Distributing DOT Safety Funds at 1/10 Rate of Biden
Funds for Safe Streets and other transportation safety and equity programs are being held up by administrative reviews and conflicts with the Trump administration’s priorities.

German Cities Subsidize Taxis for Women Amid Wave of Violence
Free or low-cost taxi rides can help women navigate cities more safely, but critics say the programs don't address the root causes of violence against women.
Urban Design for Planners 1: Software Tools
This six-course series explores essential urban design concepts using open source software and equips planners with the tools they need to participate fully in the urban design process.
Planning for Universal Design
Learn the tools for implementing Universal Design in planning regulations.
planning NEXT
Appalachian Highlands Housing Partners
Mpact (founded as Rail~Volution)
City of Camden Redevelopment Agency
City of Astoria
City of Portland
City of Laramie