


Don’t tell me what you claim to value; your budget indicates what you truly value. If we value fairness and efficiency, we must reform infrastructure spending to support inclusive, affordable, healthy, and resource-efficient modes.


What portion of transportation infrastructure investments should be devoted to each mode? That is an important and timely question. For the last century, the majority of transportation investments were devoted to roads and parking facilities. This contributed to a self-reinforcing cycle of automobile-dependency and sprawl. There are good reasons to reprioritize non-auto modes so they receive a greater share.
This issue is explored in my new report, Fair Share Transportation Planning. It estimates the portion of transportation infrastructure funding and road space devoted to various modes, and how that compares with indicators of their demand.
From what I can determine, typical North American governments invest about $50 annually per capita on sidewalks, crosswalks, and public paths; about $180 annually per capita on public transit subsidies; about $900 annually per capita on roads and traffic services; and require property owners to spend somewhere between $2,000 and $4,000 annually per capita on government-mandated off-street parking facilities.
The figure below compares the portion of transportation investments for each mode with various indicators of their demands.
Non-auto Infrastructure Spending Versus Demand Indicators
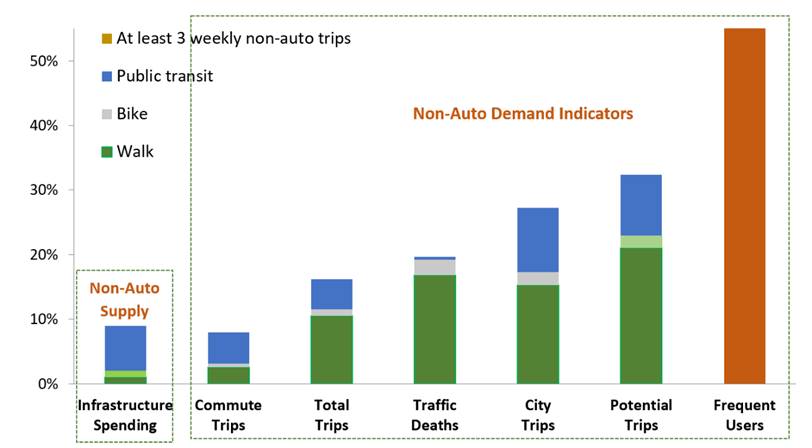
This indicates that less than 10 percent of total transportation infrastructure investments are spent on non-auto modes. This is approximately equal to their portion of commute trips but much less than their portion of total trips, traffic deaths, potential trips, or frequent users. It would be efficient and equitable to devote at least 15 percent of transportation investments to walking and bicycling facilities, or more if there is evidence of latent demands (walking and bicycling mode share would increase beyond 15 percent after their facilities are improved), to achieve strategic objectives (affordability, public safety and health, etc.), and to make up for a century of underinvestment.
Underinvestment in non-auto modes harms everybody, including motorists. Take, for example, the “school run,” trips made by parents to chauffeur children to school. Travel surveys indicate that in many communities, they represent 15 percent of morning peak vehicle trips. That’s a lot of driving, which increases vehicle expenses, time burdens, stress, traffic and parking congestion, risks, and pollution emissions. Certainly, some of these vehicle trips are justified and optimal, but many are not, and would shift to other modes if communities invested more in sidewalks, crosswalks, and public transit services.
What is optimal?
There are several ways to define the optimal level of investment in each mode.
One approach is to base investments on potential travel demands, that is, the portion of trips that travelers would make in each mode, including latent demands that would be made after improvements are completed. For example, if 10 percent of trips are made by walking, but improving walking facilities would increase this to 15 percent, sidewalks and crosswalks should receive at least 15 percent of investment.
Note that commonly-used commute mode share data significantly underestimate active mode trips because they ignore non-commute travel, commutes by children, and the walking and bicycling links of trips that include motorized modes. For example, a bike-transit-walk trip is categorized as a transit trip, and the walking links between vehicles and destinations are ignored even if they involve walking several blocks on public rights-of-way.
Investment analysis should also consider social equity goals, recognizing that many physically, economically, and socially disadvantaged people are limited in their ability to drive and rely on non-auto modes. This justifies investing a greater portion of resources on non-auto modes to ensure that all transportation facilities and services reflect universal design standards. This can justify, for example, significantly increasing funding for sidewalks, crosswalks, and paths, public transit service improvements, and complete streets roadway designs, in order to ensure that people with disabilities and low incomes have safe and convenient access to destinations.
Modal investments can also reflect cost-efficiency. For example, improving non-auto modes can help reduce traffic and parking congestion, road and parking facility costs, consume costs, crashes and pollution emissions, while roadway expansions and parking facility subsidies tend to increase vehicle travel and associated costs; all of these impacts should be considered when evaluating investments.
Another approach is to base investments on mode share targets. Many communities have targets to increase walking, bicycling and public transit, or to reduce automobile travel. For example, if governments have targets to double walking, bicycling and transit travel in order to achieve efficiency, health and environmental goals, they should at least double investments in these modes, or more to make up for a century of underinvestment. British Columbia, California, Washington State, and many local governments have such mode shift targets, but have yet to shift their investments as needed to achieve those targets.
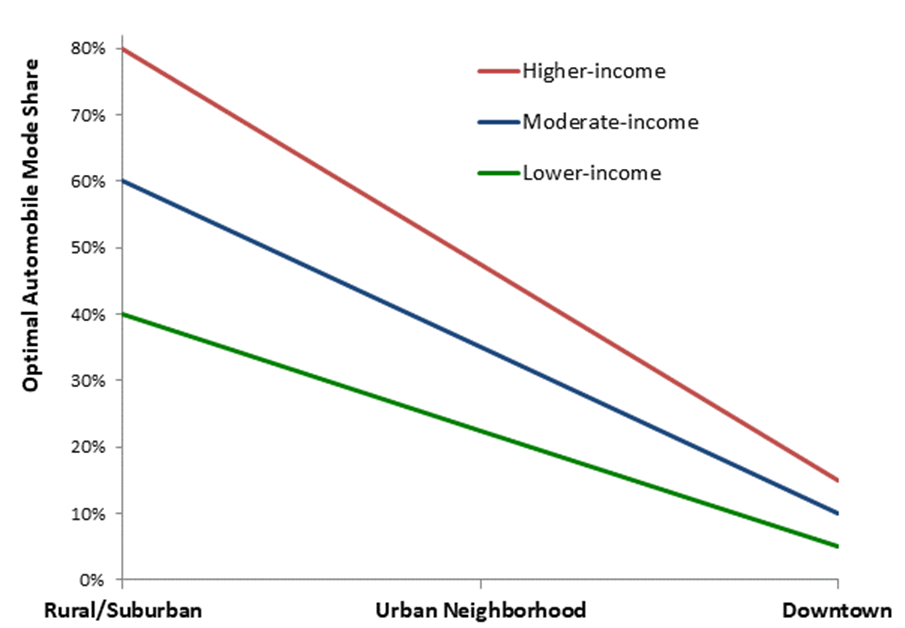
Of course, mode share targets, and therefore funding shares, should reflect local demographic and economic needs, with higher non-auto shares in areas with lower incomes, and in denser areas where automobile traffic is particularly costly and on-auto modes particularly efficient. The figure below illustrates this concept.
Optimal Automobile Mode Shares
Summary
To be efficient and equitable, a transportation system must serve diverse demands. A diverse transportation system allows travelers to use the most efficient option for each trip—safe walking and bicycling for local errands, efficient public transit when traveling on busy travel corridors, and automobiles when they are truly the most cost-effective mode considering all impact—and it ensures that people who cannot, should not, or prefer not to drive receive their fair share of public investments.
Current transportation planning practices are biased in various ways that overinvest in automobile infrastructure and underinvest in more affordable, inclusive, and efficient modes. It is time for planners to reconsider our analysis methods and funding practices to ensure that non-auto modes, and therefore non-drivers, receive their fair share of transportation resources.
This is not anti-car. Motorists have good reasons to support more investments in non-auto modes that reduce their traffic and parking congestion, reduce their chauffeuring burdens and crash risk, and provide better options when their vehicles are unavailable. Everybody wins from a more diverse and efficient transportation system.
For more information
Ralph Buehler and Andrea Hamre (2015), “The Multimodal Majority? Driving, Walking, Cycling, and Public Transportation Use Among American Adults,” Transportation 42.
Felix Creutzig, et al. (2020), “Fair Street Space Allocation: Ethical Principles and Empirical Insights,” Transport Reviews, 40:6, 711-733.
Stefan Gössling, et al. (2016), “Urban Space Distribution and Sustainable Transport,” Transport Reviews.
Alejandro Henao, et al. (2014), “Sustainable Transportation Infrastructure Investments and Mode Share Changes: A 20-Year Background of Boulder, Colorado,” Transport Policy.
ITF (2021), Reversing Car Dependency, International Transport Forum.
Todd Litman (2022), “Evaluating Transportation Equity: Guidance for Incorporating Distributional Impacts in Transport Planning,” ITE Journal, Vo. 92/4, April.
Todd Litman (2023), Fair Share Transportation Planning, World Congress for Transportation Research.
María del Mar Parra López, Jan Anne Annema and Bert van Wee (2022), “The Added Value of Having Multiple Options to Travel,” Journal of Transport Geography, Vo. 98.
Giulio Mattioli, et al. (2020), “The Political Economy of Car Dependence: A Systems of Provision Approach,” Energy Research & Social Science, Vo. 66.
OECD (2020), Reversing Automobile Dependency, International Transport Forum. Webinar video: www.youtube.com/watch?v=fLcZoTPcXbM.
Carlton Reid (2022), “Why Do So Many Motorists Feel Persecuted When in Reality They Rule the World?" Forbes.

Report Evaluates Equity in Federal Infrastructure Grants
The report indicates that large formula funding programs tend to support the status quo, reinforcing car-centric planning and inequitable spending patterns.
Building Safety, Climate Change, and Equity
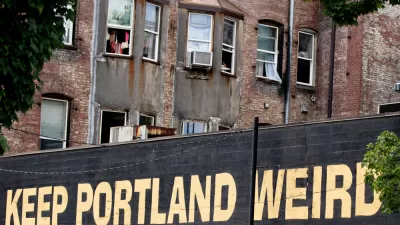
A Portland coalition is drawing attention to the disproportionate impacts of unsafe and inefficient housing on low-income households and pushing for legislation that would mandate building improvements and tenant protections.
How to Prioritize Equity in the Infrastructure Bill
Experts recommend a more rigorous focus on equity considerations as the federal government begins to select projects to fund through the Infrastructure Investment and Jobs Act.

Planetizen Federal Action Tracker
A weekly monitor of how Trump’s orders and actions are impacting planners and planning in America.
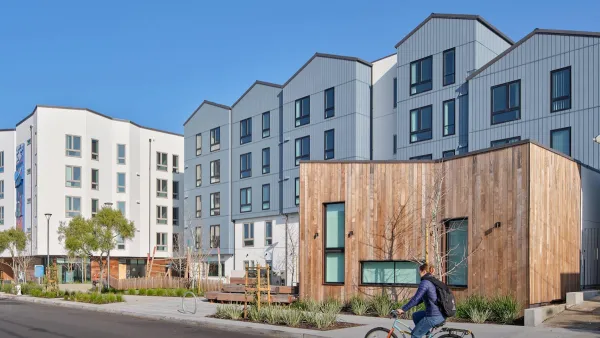
San Francisco's School District Spent $105M To Build Affordable Housing for Teachers — And That's Just the Beginning
SFUSD joins a growing list of school districts using their land holdings to address housing affordability challenges faced by their own employees.
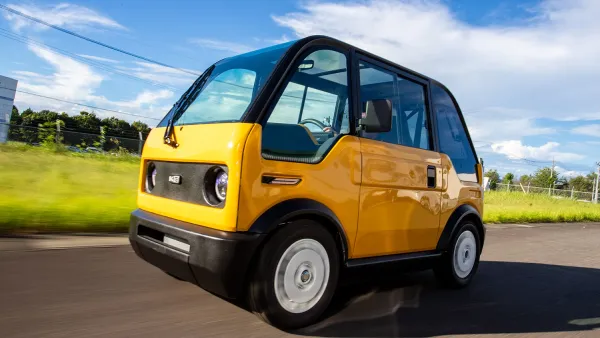
The Tiny, Adorable $7,000 Car Turning Japan Onto EVs
The single seat Mibot charges from a regular plug as quickly as an iPad, and is about half the price of an average EV.

Seattle's Plan for Adopting Driverless Cars
Equity, safety, accessibility and affordability are front of mind as the city prepares for robotaxis and other autonomous vehicles.

As Trump Phases Out FEMA, Is It Time to Flee the Floodplains?
With less federal funding available for disaster relief efforts, the need to relocate at-risk communities is more urgent than ever.

With Protected Lanes, 460% More People Commute by Bike
For those needing more ammo, more data proving what we already knew is here.
Urban Design for Planners 1: Software Tools
This six-course series explores essential urban design concepts using open source software and equips planners with the tools they need to participate fully in the urban design process.
Planning for Universal Design
Learn the tools for implementing Universal Design in planning regulations.
Smith Gee Studio
City of Charlotte
City of Camden Redevelopment Agency
City of Astoria
Transportation Research & Education Center (TREC) at Portland State University
US High Speed Rail Association
City of Camden Redevelopment Agency
Municipality of Princeton (NJ)