


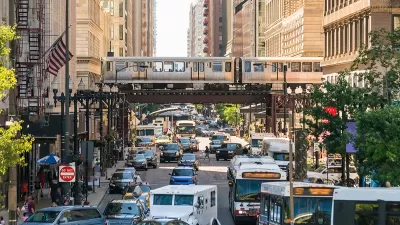
Many current planning practices reinforce a cycle of increased automobile use, more automobile-oriented community redevelopment, and reduced mobility options. There are good reasons to break this pattern.


About 20 years ago, I first created the following graphic to illustrate the self-reinforcing cycle of automobile dependency and sprawl. It has been frequently reproduced, as you can see by searching, cycle of automobile dependency on the Internet.
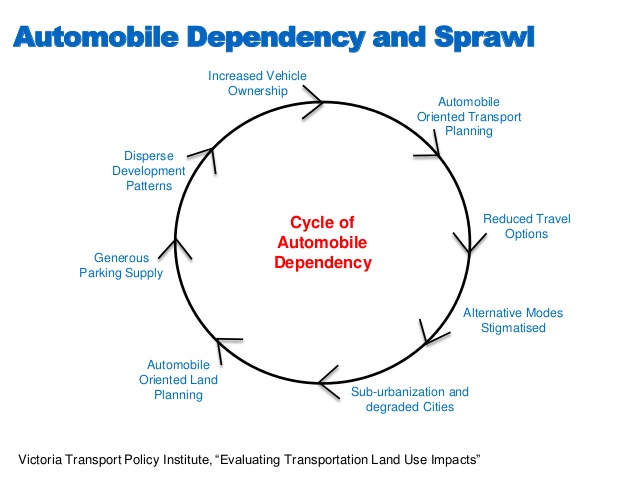
This illustrates an important point made by my friend Michael Lewyn in a recent Planetizen column, "The Wonderful World of Vicious Circles"; planning can create self-fulfilling prophecies. If we plan for growing automobile traffic by expanding roads and parking supply, the expected growth will occur, but if we plan for multi-modal mobility with investments in walking, bicycling and public transit, a community will have more balanced travel activity.
To individual decision-makers, each step in the automobile dependency cycle seems justified: if motor vehicle ownership is projected to increase it makes sense to expand roads and increase parking requirements, although this increases automobile ownership and use. The downsides, such as reduced travel options (walking, bicycling, and public transit become inefficient and stigmatized), more dispersed destinations (which increases travel distances and reduces overall accessibility), and the additional costs that result, are often overlooked in planning analysis.
It is important to consider all of these impacts because planning decisions often involve trade-offs between automobile and multi-modal accessibility [pdf]. For example, wider roads designed to maximize automobile traffic speeds tend to create barriers to walking and bicycling, reducing non-auto access. Similarly, denser development tends to reduce automobile travel speeds and parking supply, but improves walking, bicycling, and public transit accessibility. Our analysis should account for these trade-offs. For example, rather than characterize a roadway expansion as a transportation improvement, it is more accurate to say [pdf] that it improves access for motorists but reduces access for pedestrians and bicyclists, and because public transit users depend on these modes, it also reduces transit access.
A basic principle of good planning is that individual, short-term decisions should support strategic, long-term goals; otherwise we end up with suboptimal and contradictory decisions. Only by looking at the big picture can we determine the best solutions to individual problems. For example, there are many possible ways to reduce urban traffic congestion; some, such as roadway expansions, increase automobile-dependency and sprawl, while others, such as improving public transit, more efficient road and parking pricing, and transportation demand management (TDM) programs, create more multi-modal transportation systems.
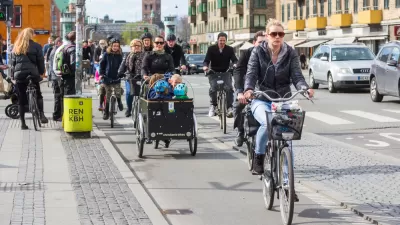
People sometimes misrepresent these issues, implying that the alternative to automobile dependency is a car-free transport system, but in most cases the best system is multi-modal, in which people use the most appropriate option for each trip: walking and bicycling for local errands, public transit on major travel corridors, and automobiles when they are truly most efficient overall, considering all impacts. Multi-modal planning ensures that everybody, including people who cannot, should not, or prefer not to drive receive their fair share of public investments in transport facilities and services. The following table summarizes these approaches.
Automobile-Dependent, Multi-modal and Car-Free Compared
|
|
Auto-Dependent |
Multi-Modal |
Car-Free |
|
Planning priority |
Motor vehicle mobility: speed and distance |
Multi-modal mobility and accessibility |
Non-auto accessibility. |
|
Mobility Options |
Automobile. Other modes are considered inefficient, to be avoided. |
Walking, cycling, transit, ridesharing, automobile and mobility substitutes |
Walking, cycling, public transit, taxi and mobility substitutes. |
|
Land use development |
Dispersed. Development along highways |
Most development is compact and mixed. |
All development is compact and mixed around transit. |
|
Vehicle parking |
Abundant and usually free. |
Moderate and often priced. |
Very limited. |
|
Vehicle ownership |
High. Over 500 vehicles per 1,000 residents. |
Moderate. 200-500 vehicles per 1,000 residents. |
Low. Less than 200 vehicles per 1,000 residents. |
|
Automobile mode share |
More than 80% |
20-80% |
Less than 20% |
Automobile-dependent, multi-modal and car-free planning differ in many ways.
Benefits of Multi-modalism
Compared with automobile travel, other modes tend to be more inclusive (they can serve a wider range of users), affordable (they cost less to use), resource efficient (they require less space for travel and parking, and less energy), healthier (they impose less traffic risk and increase physical activity and fitness), and greener (they produce less pollution and require less pavement), providing various savings and benefits. Motorists also benefit from having a more diverse and efficient transportation system that reduces the traffic and parking congestion, accident risk, chauffeuring burdens, and pollution they bear.
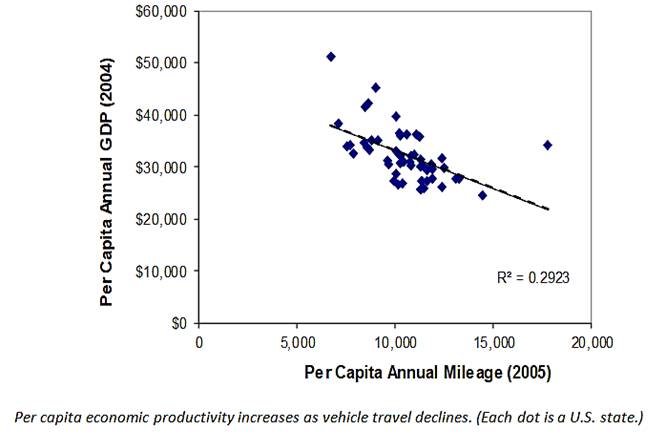
People sometimes claim, incorrectly, that automobile-oriented transportation planning increases economic productivity, claiming that highway expansion projects or low fuel taxes are "good for the economy." Although a certain amount of motor vehicle travel supports economic activities, beyond an optimal level, excessive automobile travel reduces productivity [pdf] because of the high costs it imposes. For example, automobile commuting imposes far higher vehicle, fuel, road and parking infrastructure, accident and environmental costs than the same trips made by walking, bicycling, and public transit. The figure below illustrates the negative relationship between Gross Domestic Product (GDP) and Vehicle Miles Travelled (VMT) for U.S. States.
Per Capita GDP and VMT for U.S. States
Multi-modal Transportation Benefits
Typical Impacts of Non-Auto Modes |
Benefits |
|
Space-efficient. Non-auto modes require less space per passenger-mile. |
Less traffic and parking congestion, and therefore lower road and parking costs. |
|
Non-auto modes cost less than driving. |
Increases affordability and economic resilience. |
|
Inclusive. Non-auto modes serve people who lack a vehicle or driver’s license. |
Improves mobility options for people who cannot drive. Reduces chauffeuring burdens. |
|
Increases safety. Public transit has very low crash casualty rates. Walking and cycling impose minimal risk on other road users. |
Reduces traffic casualty (injuries and deaths) rates, including risks to motorists. |
|
Non-auto modes are healthy and enjoyable to use. |
Improves public fitness and health, provides enjoyment, and supports industries such as tourism. |
|
Non-auto modes are energy efficient and low polluting |
Reduces energy consumption and resulting economic and environmental costs. |
|
Multi-modal planning supports strategic planning goals such as more compact development. |
Reduces per capita land consumption, public infrastructure costs, and improves overall accessibility. |
|
Non-auto modes reduce fuel imports, expand worker pools, provide agglomeration efficiencies, reduce infrastructure costs and support industries. |
Increases local economic development (employment, productivity, tax revenues) |
Compared with automobile travel, walking, cycling, and public transport can provide many benefits.
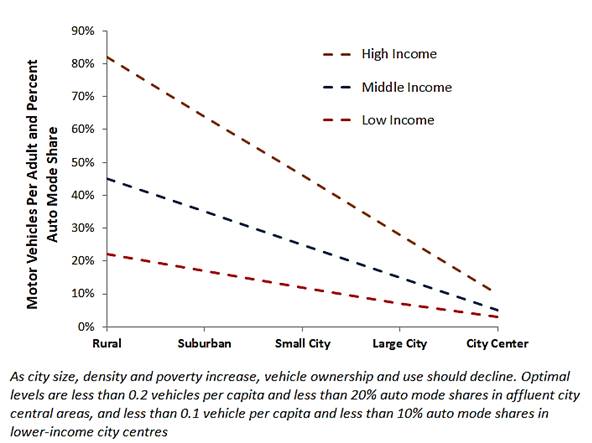
Multi-modal Targets
How much motor vehicle travel is optimal? Every community is unique. Optimal automobile mode shares will vary depending on density and incomes. In high income rural areas and suburbs, most trips can be made by automobile, but automobile mode shares should decline with city size, density and poverty, and in central urban neighborhoods less than 20% of total trips should be made by private automobile in order to maximize efficiency and social equity.
Reforms for Multi-modal Planning
Many jurisdictions are starting to reform planning to reduce automobile dependency and create more multi-modal transportation systems. For example, U.S. policy requires federal agencies to support vehicle miles traveled (VMT) reduction strategies. The state of California [pdf] has a target to reduce VMT about 15% by 2050 compared with expected levels. Oregon and Washington [pdf], and some cities [pdf] have similar targets. When all impacts are considered, such targets are justified. They provide a motivation for more comprehensive and multi-modal planning [pdf]. Several reports and websites (including the CDC) provide guidance for achieving these targets.
Multi-modal Planning Principles
- Recognize all travel demands, including by people who cannot, should not or prefer not to drive.
- Count every trip. Consider all travel, including short trips, active modes, and recreational travel in travel surveys and data analysis.
- Recognize the important roles that walking, bicycling, and public transport play in an efficient and equitable transportation system.
- Apply comprehensive analysis that considers all benefits and costs.
- Apply least cost planning, which invests resources in the most cost effective option, including alternative modes and demand management strategies, considering all impacts.
- Use transportation demand management to encourage use of efficient mobility options.
- Integrate transportation and land use planning to create accessible, multi-modal communities.
- Reduce or eliminate parking requirements and encourage efficient parking management.
Of course, no single action can transform currently automobile-dependent communities into a multi-modal communities, it requires a variety of actions, such as those listed below.
A Multi-modal Menu
- Good walking and cycling conditions, including adequate sidewalks, crosswalks, paths, bike lanes, bike parking, and vehicle traffic speed control.
- High quality public transit services, with good coverage, frequency, comfort, safety, and affordability for both local and interregional (between city) services.
- Good connectivity, including dense walking and road networks, and inter-modal connections such as walking and cycling access, and taxi services at transit stations.
- Compact, mixed urban development, which creates transit-oriented development (if located around transit stations) or urban villages (if pedestrian oriented), where most common services (shops, restaurants, schools, parks, transit stops, etc.) can be reached within a five to ten minute walk or bicycle ride of most homes and worksites.
- Efficient road, parking, fuel and insurance pricing, which, as much as possible, charges motorists for the costs they impose.
- Convenient and affordable carsharing, bikesharing, taxi, and ride-hailing services (e.g., Uber and Lyft).
- Universal design (the ability of transportation systems to accommodate people with diverse needs and abilities, including those with disabilities, babies, and heavy loads).
- Good telework options, such as on-line shopping, banking and municipal services, and efficient delivery services (mail, courier, and local shops).
- Convenient user information concerning transportation options.
- Social marketing that promotes non-automobile modes to enhance their status.
This is good news for communities. Multi-modal planning creates more efficient and equitable communities. It is our job, as planners, to communicate why and how this can be done in each community.
For More Information
Marlon G. Boarnet (2013), “The Declining Role Of The Automobile And The Re-Emergence Of Place In Urban Transportation: The Past Will Be Prologue,”Regional Science Policy & Practice, Special Issue: The New Urban World – Opportunity Meets Challenge, Vol. 5/2, June, pp. 237–253 (DOI: 10.1111/rsp3.12007).
Marlon G. Boarnet, et al. (2017), The Economic Benefits of Vehicle Miles Traveled (VMT)-Reducing Placemaking: Synthesizing a New View, National Center for Sustainable Transportation.
Scott Cohen and Stefan Gössling (2015), A Darker Side Of Hypermobility,Environment and Planning A, Vol. 47, pp. 1661-1679.
Jim Conley and Arlene Tigar McLaren (2009), Car Troubles: Critical Studies of Automobility and Auto-Mobility, Ashgate.
Stefan Gössling, et al. (2016), “Urban Space Distribution and Sustainable Transport,”Transport Reviews, Vol. 36/5.
Eric Jaffe (2015), All the Ways Germany Is Less Car-Reliant Than the U.S., in 1 Chart; There Are Rather a Lot of Ways, As it Turns Out, Atlantic CityLab.
ITDP (2012), Transforming Urban Mobility in Mexico: Towards Accessible Cities Less Reliant on Cars, Institute for Transportation and Development Policy.
Santhosh Kodukula (2011), Raising Automobile Dependency: How to Break the Trend?, GIZ Sustainable Urban Transport Project.
David Levinson (2019), The Automobile as Prison. The City as Freedom, The Transportist.
Todd Litman (2001), “You Can Get There from Here: Evaluating Transportation Choice,”Transportation Research Record 1756, Transportation Research Board, pp. 32-41.
Todd Litman (2013), “The New Transportation Planning Paradigm,”ITE Journal, Vo. 83, No. 6, pp. 20-28.
Todd Litman (2014), The Mobility-Productivity Paradox: Exploring the Negative Relationships Between Mobility and Economic Productivity, presented at the International Transportation Economic Development Conference, 9-11 April 2014, Dallas, Texas.
Todd Litman (2017), “Determining Optimal Urban Expansion, Population and Vehicle Density, and Housing Types for Rapidly Growing Cities,”Transportation Research Procedia.
Giulio Mattioli, et al. (2020), “The Political Economy of Car Dependence: A Systems of Provision Approach,” Energy Research & Social Science, Vo. 66.
Peter Newman and Jeff Kenworthy (1989), Cities and Automobile Dependency, Gower.
Peter Samuel and Todd Litman (2001), “Optimal Level of Automobile Dependency; A TQ Point/Counterpoint Exchange with Peter Samuel and Todd Litman,”Transportation Quarterly, Vol. 55, No. 1, Winter 2000, pp. 5-32.
SDC (2011), Fairness in a Car Dependent Society, U.K. Sustainable Development Commission.
Angie Schmidt (2018), Millennials Unhappily Stuck in their Parents’ Transportation System, Streetblog USA.
Gregory H. Shill (2019), “Americans Shouldn’t Have to Drive, but the Law Insists on It; The Automobile Took Over Because the Legal System Helped Squeeze out the Alternatives,” The Atlantic.
Gregory H. Shill (2020), “Should Law Subsidize Driving?” University 0f Iowa Legal Studies Research Paper No. 2019-03, New York University Law Review.
Paul Joseph Tranter (2010), “Speed Kills: The Complex Links Between Transport, Lack of Time and Urban Health,”Journal of Urban Health, Vol. 87, No. 2, doi:10.1007/s11524-009-9433-9.

Watch: How Induced Demand Explains the Vicious Cycle of Congestion
A new Vox video tackles the controversial and counterintuitive concept of induced demand.
The Inflation Reduction Act's 'Inadequate' Reliance on Electric Vehicles
Electric vehicles can help reduce greenhouse gas emissions, but not enough to prevent the worst of climate change and not as much as walkable cities with far fewer cars on the road.
Planning for Congestion Relief
The third and final installment of Planetizen's examination of the role of the planning profession in both perpetuating and solving traffic congestion.

Maui's Vacation Rental Debate Turns Ugly
Verbal attacks, misinformation campaigns and fistfights plague a high-stakes debate to convert thousands of vacation rentals into long-term housing.

Planetizen Federal Action Tracker
A weekly monitor of how Trump’s orders and actions are impacting planners and planning in America.

In Urban Planning, AI Prompting Could be the New Design Thinking
Creativity has long been key to great urban design. What if we see AI as our new creative partner?

King County Supportive Housing Program Offers Hope for Unhoused Residents
The county is taking a ‘Housing First’ approach that prioritizes getting people into housing, then offering wraparound supportive services.

Researchers Use AI to Get Clearer Picture of US Housing
Analysts are using artificial intelligence to supercharge their research by allowing them to comb through data faster. Though these AI tools can be error prone, they save time and housing researchers are optimistic about the future.

Making Shared Micromobility More Inclusive
Cities and shared mobility system operators can do more to include people with disabilities in planning and operations, per a new report.
Urban Design for Planners 1: Software Tools
This six-course series explores essential urban design concepts using open source software and equips planners with the tools they need to participate fully in the urban design process.
Planning for Universal Design
Learn the tools for implementing Universal Design in planning regulations.
planning NEXT
Appalachian Highlands Housing Partners
Mpact (founded as Rail~Volution)
City of Camden Redevelopment Agency
City of Astoria
City of Portland
City of Laramie