


A recent study suggests that families save little by moving to location-efficient neighborhoods. There are good reasons to be skeptical of that conclusion.


A recent study by professors Michael J. Smart and Nicholas J. Klein, "Complicating the Story of Location Affordability," published in Housing Policy Debate, has stimulated considerable debate concerning the impacts of location on transportation affordability. It used a geocoded version of the Panel Study of Income Dynamics (PSID) to analyze how location factors affect housing and transportation expenditures for nearly 11,000 families between 2003 and 2013.
I respect these authors and their basic findings are consistent with previous studies. They found that total transportation expenditures, and transportation cost burdens (portion of household budgets devoted to transportation), are significantly lower for high-transit (H) compared with low-transit (L) locations, and these costs are extremely low for no-car (N) households, as illustrated in Figure 2 from their report, copied below. This confirms that the ability to live car-free can provide huge savings and benefits, particularly for lower-income households.
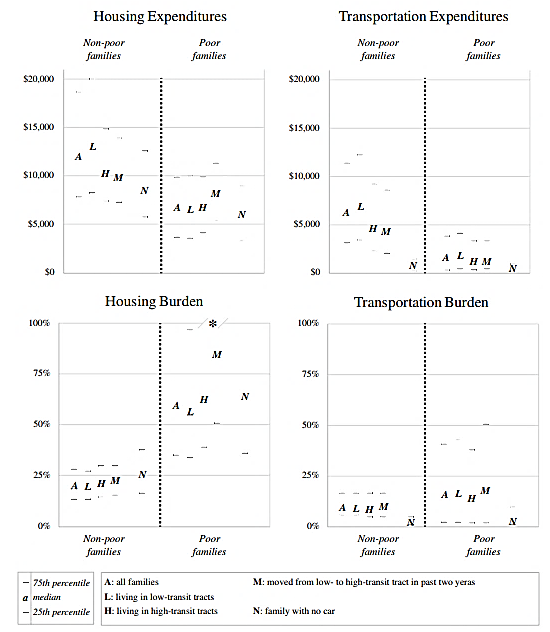
However, Smart and Klein found that families that moved from low- to high-transit neighborhoods (labeled M in the graphs) experienced small average transportation cost savings, particularly in the short-run. They conclude: "Our results suggest that changes in access to transit have a weak influence on transportation expenditures." These results have been used to criticize the Housing + Transportation Affordability Index and other Location Efficiency tools.
Hold on!
There is plenty of credible evidence that more accessible and multimodal locations do significantly reduce household transportation expenditures. Major studies by Cervero and Arrington [pdf] and Schneider, Handy and Shafizadeh [pdf] indicate that households living in transit-oriented and "Smart Growth" neighborhoods own about half as many vehicles and generate about half as many trips as in automobile-dependent, sprawled areas.
A recent National Center for Sustainable Transportation Research Report, Affordable Housing in Transit-Oriented Developments: Impacts on Driving and Policy Approaches found that in TODs, households with higher incomes tend to reduce their VMT by a greater amount than those with lower incomes, and households with lower incomes tend to increase their transit ridership by a greater amount than those with higher incomes. They found that households located in Southern California TOD drive 16 daily miles or 36% less than the region average. Similar analysis by the California Housing Partnership Corporation published in Why Creating and Preserving Affordable Homes Near Transit is a Highly Effective Climate Protection Strategy indicates that TOD locations reduce average household vehicle-travel 37% for high-income households and 50% for Extremely Low-Income household (see figure below), and reduce car ownership rates at least 30%, with particularly large reductions by Extremely Low-Income households. These studies emphasize the importance to provide affordable housing in TODs in order to maximize social equity benefits, including improved economic opportunity and affordability.

Households in Transit Oriented Developments, defined by Housing and Community Development (HCD) and High-Quality Transit Areas (HQTA) metrics, drive significantly less than those in non-TOD areas.
Using U.S. Consumer Expenditure Survey data, I found a strong negative relationship between per capita transit ridership and the portion of household spending devoted to transportation, as illustrated the second graph in my previous column, Responding to Public Transit Criticism. Griffiths and Curtis, Effectiveness of Transit Oriented Development in Reducing Car Use, found that as a TOD develops, public transport use increases and car use declines over time, which indicates the importance of long-term impact analysis.
So, what could explain Smart and Klein's anomalous results?
First, the transportation expenditure data seem incomplete and biased. The table below compares, as well as possible, average transportation expenditure data from Smart and Klein's Panel Study of Income Dynamics (PSID), the Bureau of Transportation Statistic's 2016 Consumer Expenditure Survey (CES), and the American Automobile Association's (AAA) Your Driving Costs. Unfortunately, definitions and data collection methods differ, making them difficult to compare. The PSID survey has very low vehicle maintenance, repair and tire costs values, just $82 annual per vehicle, which is an order of magnitude smaller than indicated by other sources. These costs tend to be particularly high for the older vehicles generally driven by lower-income motorists. As a result, the PSID study appears to significantly underestimate the full transportation costs in automobile-dependent areas, and the savings from high-transit locations.
Transportation Expenditures Compared
| Expenses |
PSID |
CES |
AAA |
||
|
Per Household |
Per Vehicle |
Per Household |
Per Vehicle |
Per Vehicle |
|
|
Vehicles |
1.6 |
1.9 |
|||
|
Car purchase/lease/loan |
$3,107 |
$1,942 |
$4,294 |
$2,260 |
$2,840 |
|
Gasoline/fuel |
$2,314 |
$1,446 |
$1,909 |
$1,005 |
$1,500 |
|
Vehicle Insurance |
$1,310 |
$819 |
$1,149 |
$605 |
$1,023 |
|
Maintenance, repairs and tires |
$131 |
$82 |
$849 |
$447 |
$1,186 |
|
Parking |
$37 |
$23 |
|||
|
Other vehicle expenses |
$108 |
$68 |
$225 |
$118 |
|
|
Taxi |
$37 |
||||
|
Public Transit |
$104 |
$623 |
|||
|
Other transportation |
$95 |
||||
|
Totals |
$7,250 |
$4,380 |
$9,049 |
$4,435 |
$6,549 |
PSID transportation expenditure values, particularly "Repairs, maintenance and tires," are much lower than other sources. This suggests that their study underestimated transport costs in low-transit areas, particularly for lower-income families.
I can report from personal experience that typical automobiles incur maintenance, repair and tire replacement costs that exceed $1,000 annually, and that living in a walkable and transit-rich neighborhood allows households to save $5,000+ annually compared with automobile-dependent, sprawled areas. If a survey fails to find such savings the fault may be in its methods rather than in the concept of location efficiency.
The conclusion that transportation costs are under-reported is supported by the bottom right graph in Figure 2, which indicates that non-poor households only devote about 8% of their budgets to transportation, which is about half the 15.8% indicated in the Consumer Expenditure Survey (line 406).
A second striking finding in the study is the very high housing and transportation costs borne by low-income Movers (M in Figure 2), which suggests that such moves are associated with other financial stresses, and the supply of affordable housing and transportation options in accessible neighborhoods is declining as affluent households move into available housing. As a result, low-income households are seldom able to find suitable affordable housing in accessible locations.
As Smart and Klein point out, many factors affect households' location and vehicle ownership decisions, including many that could be confounding with affordability. For example, moves from low- to high-transit areas may often coincide with household financial crises that reduce incomes, or with new jobs that require vehicle ownership. Although a 11,000 sample size seems large, if they averaged two moves during the study period, 10% moved from low- to high-transit, and 10% are poor, there are only about 220 relevant samples. That small sample size could be influenced by a relatively small number of households with confounding factors.
Another surprising factor is the large variations in transportation expenditure and vehicle ownership changes by movers to different transit-rich urban regions, indicated in Table 4. Households that moved to New York, Chicago and Boston achieved large financial savings, but those moving to San Francisco, Washington DC and Philadelphia spend substantially more. Households that moved to Chicago, San Francisco and Boston gained vehicles, while those moving to New York, Washington DC and Philadelphia shed vehicles. These conflicting patterns could reflect the small numbers of households in these categories, resulting in large random fluctuations, or reflect the fact that moves are often associated with other life changes, such as new jobs or relationships. These factors confound the affordability impacts of accessible locations.
Affordability reflects households' ability to purchase essential goods; it is a potential not necessarily reflected by current expenditures. Many households spend more on transportation than functionally necessary, for example, owning more expensive vehicles, and driving more miles, than essential. The key question is whether they can reduce these cost burdens when they face a financial stress, such as reduced income or a new financial burden. Living in a more accessible neighborhood gives households the ability to reduce their vehicle costs if needed. There is good evidence that residents of more accessible locations are more economically resilient, as indicated by lower housing foreclosure rates. See, for example, Rauterkus, Thrall and Hangen’s, Location Efficiency and Mortgage Default [pdf], and Gilderbloom, Riggs and Meares' recent article, Does Walkability Matter? An Examination of Walkability’s Impact on Housing Values, Foreclosures and Crime.
Overall, I agree with most of Smart and Klein's conclusions. They state:
"Living in a transit-rich neighborhood has many benefits. We believe it is crucial that families have the opportunity to live in these communities to access jobs, education, shopping, and other services, without having to own a car. For many families, particularly poor families, this could be an excellent strategy to reduce costs."
However, the PSID cost data they rely on appear to be faulty. It is unrealistic that total vehicle maintenance, repair and tire costs total just $82 annually per vehicle. Even more important, there are probably significant confounding factors that affect household moves that hide the effects of location on affordability. More comprehensive and accurate analysis will probably show much larger savings from accessible locations, particularly over the long-run.
I therefore believe that it would be wrong to conclude from this study that transit-oriented development provides little savings or affordability benefits. On the contrary, the high housing and transport costs borne by households that move to transit-rich neighborhoods indicate the need for much more affordable housing in such areas so that any household, including those with low incomes or mobility impairments, can find suitable housing in walkable urban neighborhoods, and enjoy associated savings, economic opportunities, and health benefits, without incurring the excessive housing cost burdens indicated by the survey.
Of course we need comprehensive and accurate information for evaluating affordability. I hope that Smart and Klein's study stimulates more and better research on this important issue.


Airport-Adjacent Seattle Suburb Aims for a Transit-Oriented Overhaul
The challenges and opportunities of transforming from a car-centric to a transit-oriented, affordable built environment are on display in a Seattle suburb.

An Accurate Answer to an Interesting Question: Are Compact Neighborhoods Really Most Affordable?
Contrary to recent claims, the evidence really does indicate that compact, multi-modal neighborhoods tend to be most affordable overall, considering both housing and transportation costs.

Transit Oriented Development Increases Value and Affordability
The new TOD Index provides solid information on Transit-Oriented Development impact and benefits. It indicates that home values near rail stations outperform the national market, yet they are also more affordable for residents.

Planetizen Federal Action Tracker
A weekly monitor of how Trump’s orders and actions are impacting planners and planning in America.

Map: Where Senate Republicans Want to Sell Your Public Lands
For public land advocates, the Senate Republicans’ proposal to sell millions of acres of public land in the West is “the biggest fight of their careers.”

Restaurant Patios Were a Pandemic Win — Why Were They so Hard to Keep?
Social distancing requirements and changes in travel patterns prompted cities to pilot new uses for street and sidewalk space. Then it got complicated.

Platform Pilsner: Vancouver Transit Agency Releases... a Beer?
TransLink will receive a portion of every sale of the four-pack.

Toronto Weighs Cheaper Transit, Parking Hikes for Major Events
Special event rates would take effect during large festivals, sports games and concerts to ‘discourage driving, manage congestion and free up space for transit.”

Berlin to Consider Car-Free Zone Larger Than Manhattan
The area bound by the 22-mile Ringbahn would still allow 12 uses of a private automobile per year per person, and several other exemptions.
Urban Design for Planners 1: Software Tools
This six-course series explores essential urban design concepts using open source software and equips planners with the tools they need to participate fully in the urban design process.
Planning for Universal Design
Learn the tools for implementing Universal Design in planning regulations.
Heyer Gruel & Associates PA
JM Goldson LLC
Custer County Colorado
City of Camden Redevelopment Agency
City of Astoria
Transportation Research & Education Center (TREC) at Portland State University
Camden Redevelopment Agency
City of Claremont
Municipality of Princeton (NJ)