


Contrary to recent claims, the evidence really does indicate that compact, multi-modal neighborhoods tend to be most affordable overall, considering both housing and transportation costs.


Planners are often asked to answer interesting questions, that is, questions that can be defined and measured in many different ways. Answering interesting questions tends to be challenging but satisfying because it requires thoughtful and creative research. Much of my career involves performing and critiquing such research. Let me share some lessons, based on a recent example of bad research concerning how urban form affects housing and transportation affordability.
There is now an extensive body of credible research indicating that homes in a compact, multi-modal neighborhood tend to be most affordable overall, considering both housing and transportation costs, compared with houses in sprawled, automobile-dependent areas. Information on this issue is available at Location Affordability Portal, the Housing and Transportation (H+T) Index Website, and How Affordable Is HUD Affordable Housing?
However, there are dissenters who search for evidence that compact development is costly. For example, a recent blog by Fanis Grammenos, Are Compact Cities More Affordable? argues that "compactness and access to transit do not produce the affordability benefits that have been claimed."
Grammenos bases his analysis on a report, Housing and Transportation Cost Burden Study, which calculates average housing and transportation costs for working households (i.e., a household member is employed) that pay mortgages or rent houses in various districts in the Vancouver, Canada region. His analysis incorporates significant errors, and the results do not really support his conclusions.
Grammenos fails to consider significant biases in the data, a classic mistake. He assumes that it is appropriate to directly compare homeowner and renter cost burdens, which ignores a critical difference: "legacy" households that purchased homes many years ago have relatively low mortgage payments due to inflation and rising incomes.
My own household is a good example. When we purchased our home 20 years ago, our mortgage payments represented approximately 30 percent, and total housing expenses an unaffordable 50 percent, of our income. Since then, our mortgage payments stayed constant but our income has about tripled, so our mortgage costs are now about 10 percent, and total housing expenses an affordable 20 percent, of our income. About half of the households on our block are similar long-time homeowners who currently pay relatively small mortgages, although many would find their homes unaffordable to purchase now. As a result, our block would be considered affordable if measured by current average expenditures, but unaffordable based on our ability to purchase a house here. There is no comparable factor affecting rental housing: most renters pay market prices which can increase annually with housing prices. Ignoring this factor makes homeownership seem more affordable compared renters, and understates financial stresses to many recent and current home buyers. In other words, Grammenos uses backward-looking data although most housing affordability discussions, and the H+T affordability analyses that Grammenos criticizes, are forward-looking, designed to reflect the trade-offs facing current home buyers.
The crux of this issue is whether locating in a compact, multi-modal neighborhood provides significant transportation cost savings. In fact, Grammenos's own research shows that households in compact regions typically spend 30-40 percent less on transportation than in more sprawled regions. Since he used 2014 data, this represents transportation costs during a period of historically low fuel prices; these cost savings are much larger when oil prices are higher.
Such regional-scale analysis understates the full potential savings provided by compact locations because even relatively sprawled regions such as Atlanta and Phoenix have some compact, multi-modal neighborhoods, and even compact regions such as San Francisco and New York have some sprawled areas. More fine-grained geographic analyses tends to indicate much greater transportation cost variability: transit-oriented neighborhood residents typically own about half as many vehicles and spend about half as much on transportation as they would if they lived in an automobile-dependent area.
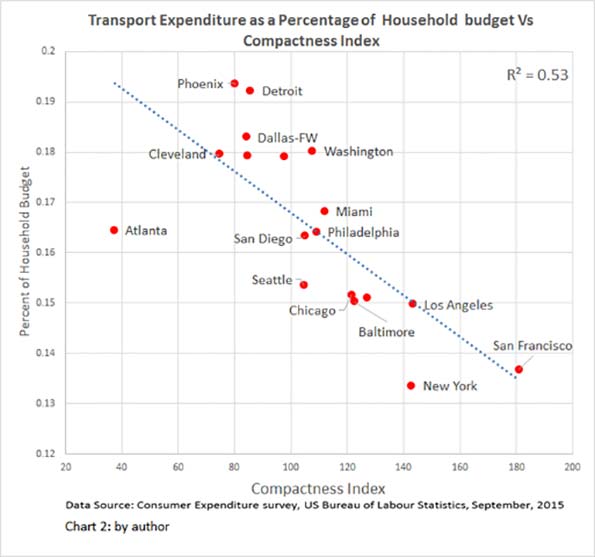
In his Chart 2, Grammenos indicates that transportation cost burdens are nearly twice as high in sprawled, automobile-dependent areas such as Langley and Surrey than in more compact and multi-modal areas such as Vancouver and the UBC district. This confirms the key argument for H+T analysis: locating in a compact district can reduce the portion of household budgets devoted to transport by 5-15 percentage points, leaving more money to spend more on housing. As discussed in my recent column, Selling Smart Growth, such shifts tend to provide various benefits including long-term wealth gains, increased economic resilience, reduced chauffeuring burdens, and reduced traffic risk.

Chart 2 courtesy of Fanis Grammenos, as originally published in New Geography.
Grammenos finds little correlation between rapid transit service availability, indicated by a district containing a SkyTrain station, and affordability, and so concludes that "access to transit do not produce the affordability benefits that have been claimed." This again represents the wrong geographic scale. Although districts such as Surrey, Richmond, and Burnaby contain SkyTrain stations, they are overall automobile-dependent suburbs. To accurately measure public transit affordability impacts it is necessary to measure transportation expenditures in the transit-oriented neighborhoods close to these stations. In fact, a recent study did find substantially lower vehicle ownership rates, and therefore transportation costs, around SkyTrain stations compared with otherwise comparable households located further away.
Contrary to Grammenos's claims, his analysis actually indicates that for lower-income households (indicated by renters), housing and transportation affordability increases significantly as districts become more compact and multi-modal. Look at the dots with red labels in his Chart 4 copied below; these show that the portion of renter household’s budgets devoted to housing and transport is lowest in the city of Vancouver (45 percent), slightly higher in the adjacent suburb of North Vancouver (46 percent), significantly higher in outer suburbs such as Richmond, Burnaby, and Surrey (48-50 percent), and highest in exurban districts such as Coquitlam, Maple Ridge, Langley, and West Vancouver (54-58 percent). Outliers, such as Pitt Meadows and Port Moody, are exurban areas with small populations, and UBC/UEL, a university district with many low-income students.
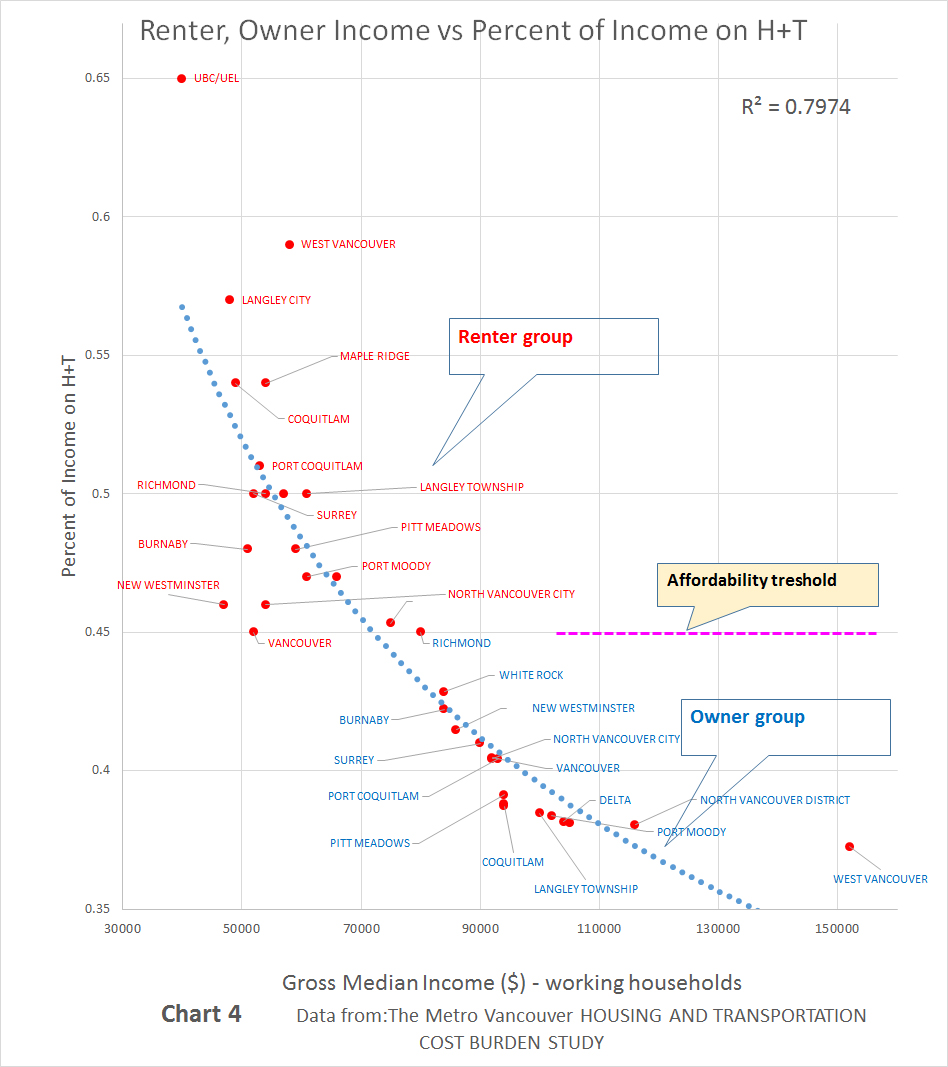
Chart 4 courtesy of Fanis Grammenos, as originally published in New Geography.
In contrast to renters, mortgage payers (Grammenos labels them "Owners," but the data actually exclude households that own their homes outright) follow the opposite pattern: the districts where household devote the smallest portion of their budgets to housing and transport tend to be sprawled but very affluent, such as West Vancouver and Port Moody, compact districts such as Vancouver and North Vancouver are in the middle, while the highest values are found in lower-income suburbs including Burnaby, Richmond and White Rock. This raises an important issue: how should "affordability" be defined and measured for public policy analysis. Although affluent households may be concerned about luxury car and house costs, from society's perspective affordability is primarily concerned with households' ability to pay for basic goods and services such as food, shelter and local transport, so for public policy debates, affordability analysis should generally focus on lower-income cost burdens, represented in this data set by renters and residents of lower-income districts such as Richmond and White Rock.
The large differences in affordability-versus-compactness patterns between renter and mortgage-paying households also illustrates the effects of the legacy mortgage payers who pay relatively small mortgages due to inflation and income growth. As a result, these data provide little useful information regarding the financial stresses facing middle-income households that recently purchased a home or hope to purchase one in the future. The pattern found for renters, with much greater affordability in compact districts, probably applies also to these recent and future home buyers.
Grammenos's analysis certainly does not support his conclusion that, "Overall, the data shows that for working homeowners there are no locations in the Metro Vancouver Region, whether urban, suburban or exurban, that push housing costs or the combined costs of housing and transportation above the affordability threshold. Urban form is not affecting budgets in these households." That statement is based on biased housing cost analysis that ignores the unaffordability of purchasing a home on an average income, and it ignores the overwhelming evidence from his own analysis showing substantial transportation cost savings and increased affordability for lower-income households that locate in compact and multi-modal neighborhoods.
Grammenos made similar errors in his previous blog post, What Price Urban Density? In it, he uses biased data (a household expenditure survey from 2014, when compact city housing costs had escalated and fuel prices were historically low), uses regional rather than neighborhood scale analysis, and exaggerates the credibility of his results (his key finding, that housing and transportation affordability declines with regional compactness, has an R2 value of 0.042, which indicates that this relationship is insignificant, overwhelmed by other factors that affect affordability). This is a good example of research intended to prove a point, which therefore ignores critical weaknesses in the analysis. Contrary to Grammenos' claims, his analysis provides no credible evidence that typical middle- and low-income households cannot save money overall and build more long-term wealth by choosing to live in a compact, multi-modal neighborhood instead of automobile-dependent sprawl.
Key lessons for interesting research:
- Clearly define research questions. Recognize that there are often multiple perspectives, definitions, and impacts to consider. In this case, affordability analysis should generally focus on cost burdens to lower- and middle-income households.
- Critically evaluate data sets used in analysis. Consider whether they are accurate, representative, and appropriate; responsible researchers clearly describe possible biases and uncertainties. In this case, home ownership costs are biased downward by "legacy" mortgage payers who purchased homes decades ago, so their values should not be compared directly with those of renters, and are not representative of the cost burdens facing recent or future home buyers.
- Don't ignore evidence that contradicts your expected outcome. In this case, the data clearly show that renters' (and therefore lower-income households') housing and transportation affordability is highest in compact, multi-modal areas and declines almost linearly as districts become more sprawled.
- Be cautious about conclusions. Don't make claims not clearly supported by the evidence. In this case, Grammenos' conclusions reflect his ideology, not what his analysis actually indicate. At most he could reasonably conclude that compact development does not necessarily reduce housing and transport cost burdens for higher-income mortgage payers, but even that conclusion should include an acknowledgement that the data are biased by older, legacy households and so does not apply to recent or future house buyers, many of whom could benefit overall by choosing homes in more compact, multi-modal neighborhoods with lower transportation costs.


The Housing Supply Debate: Evaluating the Evidence
Let's rely on science, not ideology and propaganda, when planning solutions to urban unaffordability. Look for credible evidence in the peer-reviewed publications referenced here.

The Right to the City: Planners’ Role in Creating Affordable and Inclusive Communities
In a modern, post-industrial society, economic opportunity depends on disadvantaged households’ ability to find suitable housing in an economically successful city. Planners can make that happen.
Dynamic Planning for Affordability
Conventional planning is static, designed to lock in existing land use patterns. We need more dynamic planning to respond to changing household needs and community goals.

Planetizen Federal Action Tracker
A weekly monitor of how Trump’s orders and actions are impacting planners and planning in America.

Maui's Vacation Rental Debate Turns Ugly
Verbal attacks, misinformation campaigns and fistfights plague a high-stakes debate to convert thousands of vacation rentals into long-term housing.

San Francisco Suspends Traffic Calming Amidst Record Deaths
Citing “a challenging fiscal landscape,” the city will cease the program on the heels of 42 traffic deaths, including 24 pedestrians.

Defunct Pittsburgh Power Plant to Become Residential Tower
A decommissioned steam heat plant will be redeveloped into almost 100 affordable housing units.

Trump Prompts Restructuring of Transportation Research Board in “Unprecedented Overreach”
The TRB has eliminated more than half of its committees including those focused on climate, equity, and cities.

Amtrak Rolls Out New Orleans to Alabama “Mardi Gras” Train
The new service will operate morning and evening departures between Mobile and New Orleans.
Urban Design for Planners 1: Software Tools
This six-course series explores essential urban design concepts using open source software and equips planners with the tools they need to participate fully in the urban design process.
Planning for Universal Design
Learn the tools for implementing Universal Design in planning regulations.
Heyer Gruel & Associates PA
JM Goldson LLC
Custer County Colorado
City of Camden Redevelopment Agency
City of Astoria
Transportation Research & Education Center (TREC) at Portland State University
Jefferson Parish Government
Camden Redevelopment Agency
City of Claremont