


Motor vehicles are expensive to own and operate. Many lower-income households spend more on transportation than they can afford due to a lack of affordable mobility options. The solution is more multimodal planning.

"Annual income twenty pounds, annual expenditure nineteen six, result happiness. Annual income twenty pounds, annual expenditure twenty pound ought and six, result misery." Charles Dickens (1849), David Copperfield
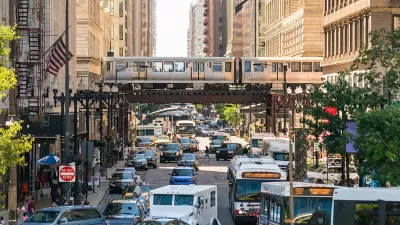
My recent column, "Transportation for Everyone," described how multimodal planning can create communities where residents can access services and activities without a car. This offers many direct and indirect benefits. Let's explore what this means for residents' economic freedom, opportunity, and security.
Affordability was previously defined as households devoting no more than 30% of their budgets to housing, but since households often make trade-offs between housing and transportation expenses (a cheap house is not really affordable if located in an isolated area with high transport costs, and households can rationally spend more than 30% of their budget on housing that is located in accessible, multimodal neighborhoods where transport costs are minimal), many now define affordability as households spending no more than 45% of their budget on housing and transport combined.
The figure below illustrates average U.S. household expenditures, indicating that most most households exceed this threshold (dashed line in the graph). When lower-income households cannot afford food, medicine, or higher education, the real cause is often unaffordable housing and transportation that leaves too little money for other essential goods.
Average Household Expenditures by Income Quintile
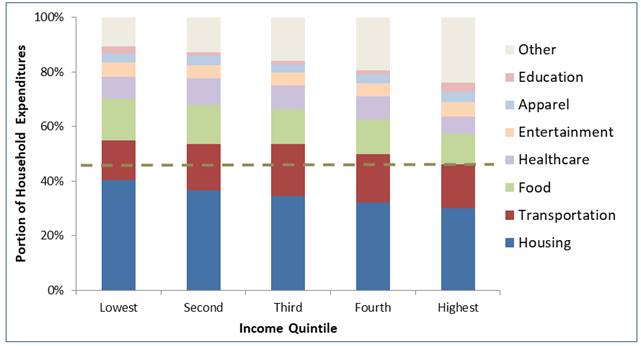
Most households spend more than 45% of their budgets on housing and transportation (dashed line), which is considered unaffordable.
Of course, every household is unique, with its own transportation needs and abilities. The amount that a household should rationally devote to transport depends on their incomes, other cost burdens, and their mobility needs. Since most lower-income (first and second quintile) households spend significantly more than 30% of their budgets on housing, most should spend significantly less than 15% of their budgets on transport.
Since approximately a third of lower-income households own their homes and a quarter are car-free (they own no vehicles), these average statistics overstate the cost burdens on some households and understate those burdens on households that pay rents or mortgages, and own automobiles.
Households can justify owning a vehicle if needed to operate a personal business or commute to a higher-paying job, provided that the extra income significantly exceeds the additional expenses; for a typical worker that would mean earning at least $4,000 more per year or $2.00 more per hour. Some households need a vehicle to transport a member with a disability or for a sport or hobby (for example, as a university student our son spent a large portion of his income on a car in order to enjoy his passion for whitewater kayaking), while others may want to own fewer vehicles than they could afford in order to spend more on education or travel or because they enjoy a car-free lifestyle.
Although lower-income motorists use many strategies to minimize their vehicle expenditures—they purchase older vehicles and minimal insurance coverage, and perform their own repairs when possible—it generally costs thousands of dollars annually to legally own and operate an automobile. It may be possible to spend less than $3,000 dollars a year for a vehicle driven just a few thousand annual miles, but motorists who drive more than about 6,000 annual miles must generally spend at least $5,000 annually for insurance, registration, fuel, maintenance and repairs, and other expenses. These cost burdens can be particularly harmful to financially insecure households because motor vehicles often impose large, unexpected expenses for repairs, crashes and traffic citations; a good rule-of-thumb is that households should not own a motor vehicle unless their budget can easily absorb a sudden $2,000 expense.
The table below indicates average after-tax incomes for the lowest three income quintiles. Assuming that a basic car that is driven regularly (say, more than 6,000 miles per year) costs at least $5,000 annually to own and operate, the lowest-income quintile households cannot afford automobile ownership, the second-income quintile households can only afford a car if their housing costs are low (less than 30% of budget), and the third income quintile can afford one car if their housing costs are high, and two cars only if their housing costs are low. Of course, many households spend more on vehicles than is affordable, which leaves them with insufficient money to spend on other essential goods, including food, healthcare and education.
Affordable Transportation Budgets
|
Quintile (After-Tax Income) |
High housing - Low Transport (35% housing, 10% transport) |
Average (30% housing, 15% transport) |
Low housing – High Transport (25% housing, 20% transport) |
|
First ($11,416) |
$1,142 |
$1,712 |
$2,284 |
|
Second ($28,727) |
$2,873 |
$4,309 |
$5,746 |
|
Third ($46,807) |
$4,681 |
$7,021 |
$9,362 |
This table shows the amounts that households can afford to spend on transportation, based on their incomes and housing expenditures, assuming that housing and transport should total less than 45% of total spending. This indicates that a third or more of households cannot afford car ownership, and about half of all households can only afford one car.
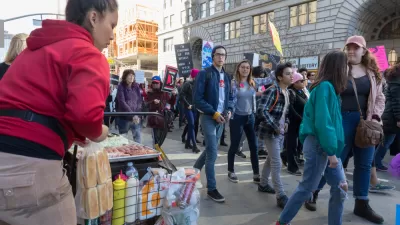
This indicates that more than a third of households cannot afford a car, and about half can only afford one. At some point in time, most households need affordable transportation options that allow multiple adults to share one vehicle and avoid the costs of second and third cars, or to deal with a vehicle failure or medical problem that limits driving. This is in addition to many other benefits of living in multimodal communities, including improved safety and health, and reduced chauffeuring burdens.
Unfortunately, many communities fail to serve these consumer demands. Currently in the United States, there are 1.9 vehicles per household and 87% of households own at least one vehicle, which is far higher than this analysis indicates is affordable. A lack of affordable transportation options forces many households to spend more on vehicles than is rational, reducing their economic freedom, opportunity, and security.
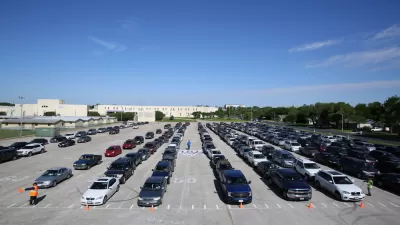
Automobile unaffordability is reflected by high housing foreclosure rates in sprawled, automobile-dependent areas, and high subprime auto loan default rates. Many lower-income households purchase cars on credit but cannot maintain their payments. These are generally old, unreliable vehicles with high operating costs and little resale value, purchased with high interest rates. In many cases, consumers continue to bear debt even after vehicles are repossessed. Wall Street experts consider this an economic risk, but planners should also recognize that each subprime vehicle loan default is a personal tragedy: a financially struggling household that, because they lack affordable transport options, is forced to spend its scarce dollars on a low-value and unreliable vehicle, which they lose due to an unexpected financial stress.
There are solutions. I can report from personal experience that it is possible to live car-free or car-light (one car shared by multiple drivers); my wife and I have not owned a car in nine years. We walk, bike, bus, and occasionally use taxis. This is constraining in some ways but liberating in others: we don’t worry about vehicle parking, repairs or tickets, and we save $5,000-10,000 annually compared with automobile-dependent peer households, which financed our children's university education. All this walking and cycling keeps us fit without requiring special time or expenses, and results in frequent neighborly interactions so we now know most residents, and pets, on our street. This lifestyle is possible because we live in an accessible and multimodal [pdf] neighborhood.
Some studies indicate that lower-income workers in automobile-oriented cities such as Los Angeles tend to earn more if they have an automobile available for commuting, but on average, all the additional income is spent on additional vehicle expenses so they are no better off financially. Living in a more accessible, multimodal community increases economic opportunity. One major study found strong correlations between neighborhood accessibility and higher economic mobility (the chance that a child in a low-income household will eventually earn a high income): a child born to the bottom fifth income group that lives in a neighborhood with a high WalkScore is much more likely to become financially prosperous than a poor child born in a less walkable area. Another major study found that children born in lower-income households located in compact, multimodal communities are much more likely to be economically successful than otherwise similar children that grow up in sprawled, automobile-dependent communities.
Of course, not every household chooses the cheapest transportation option: many choose to spend more on vehicles than functionally necessary, for status or enjoyment sake. However, it is important that households be able to reduce their transportation costs if needed to respond to a financial stress, such as reduced incomes or an unexpected financial burden. Multimodal planning provides true economic freedom, opportunity and security.

Automobile Dependency: An Unequal Burden
Automobile-dependent planning has changed automobiles from a luxury into a necessity. Excessive vehicle costs leave many households without money to purchase essential food, shelter and healthcare. They need more affordable transportation options.
The Right to the City: Planners’ Role in Creating Affordable and Inclusive Communities
In a modern, post-industrial society, economic opportunity depends on disadvantaged households’ ability to find suitable housing in an economically successful city. Planners can make that happen.
Land-Use Regulation, Income Inequality and Smart Growth
A recent paper by Harvard economists Daniel Shoag and Peter Ganong titled, Why Has Regional Convergence in the U.S. Stopped? indicates that land development regulations tend to increase housing costs, which contributes to inequality by excluding lower-income households from more economically productive urban regions. Does this means that planners are guilty of increasing income inequality?

Maui's Vacation Rental Debate Turns Ugly
Verbal attacks, misinformation campaigns and fistfights plague a high-stakes debate to convert thousands of vacation rentals into long-term housing.

Planetizen Federal Action Tracker
A weekly monitor of how Trump’s orders and actions are impacting planners and planning in America.

San Francisco Suspends Traffic Calming Amidst Record Deaths
Citing “a challenging fiscal landscape,” the city will cease the program on the heels of 42 traffic deaths, including 24 pedestrians.

Defunct Pittsburgh Power Plant to Become Residential Tower
A decommissioned steam heat plant will be redeveloped into almost 100 affordable housing units.

Trump Prompts Restructuring of Transportation Research Board in “Unprecedented Overreach”
The TRB has eliminated more than half of its committees including those focused on climate, equity, and cities.

Amtrak Rolls Out New Orleans to Alabama “Mardi Gras” Train
The new service will operate morning and evening departures between Mobile and New Orleans.
Urban Design for Planners 1: Software Tools
This six-course series explores essential urban design concepts using open source software and equips planners with the tools they need to participate fully in the urban design process.
Planning for Universal Design
Learn the tools for implementing Universal Design in planning regulations.
Heyer Gruel & Associates PA
JM Goldson LLC
Custer County Colorado
City of Camden Redevelopment Agency
City of Astoria
Transportation Research & Education Center (TREC) at Portland State University
Jefferson Parish Government
Camden Redevelopment Agency
City of Claremont