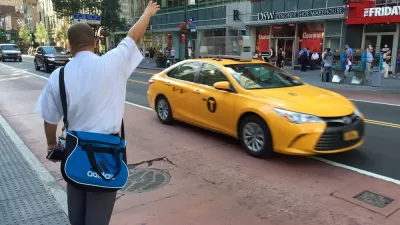
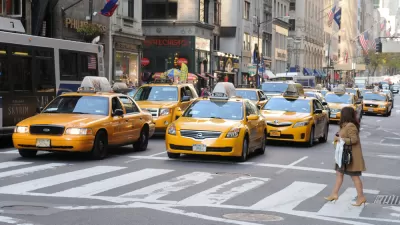
There are still a lot of unanswered questions about the effect transportation network companies like Uber will have on mobility. Are we asking the right ones?
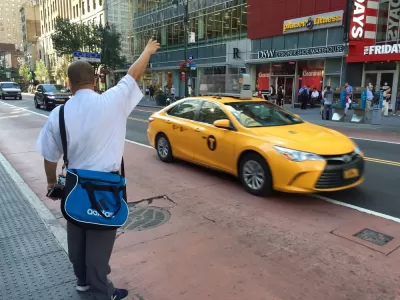
The traveling public, the transportation planning community, the media, and policymakers have all been fascinated by the evolution of transportation network companies (TNCs) and self-driving technology. A variety of adjectives have been used to characterize the significance of these emerging trends in transportation, with terms such as "transformational" describing the high expectations resulting from technology development. Stunning valuations of Uber's money-losing business and high-profile pronouncements from the likes of Tesla's Elon Musk and Google's prior program director, Chris Urmson, added to the credibility of optimistic pronouncements.
"I almost view it as a solved problem. We know what to do, and we'll be there in a few years...You'll be able to tell your car, 'Take me home, go here, go there,' anything all will address." -Elon Musk in interview reported in Fortune, March 18, 2015.
Recently, a more pragmatic approach includes a March 2016 statement from Urmson, "How quickly can we get this into people's hands? If you read the papers, you see maybe it's three years, maybe it's thirty years. And I am here to tell you that, honestly, it's a bit of both." In a similar vein, Slate published an article addressing the challenges of making artificial intelligence act like humans and the New York Times coverage included expert quotes like, "It's going to be a very long time before a self-driving car will be able to make all the kinds of trips that Uber does every single day."
In the meantime, planners are faced with a huge challenge of understanding what the implications of technology are on travel behavior and transportation and, perhaps more importantly, what planning steps we should take to facilitate the most beneficial evolution of technology within transportation.
Leaving aside planning for self-driving cars, there's a growing basis for varying perspectives on the implications of transportation network companies and "Mobility as a Service" (MAAS) concepts. While many in the planning community are interested in evaluating the mobility and accessibility implications of TNCs, many planners are most interested in understanding the economic viability and potential travel demand consequences of these services. My interest was piqued by a recent Bloomberg Technology news story, "Lyft Loses $600 Million in 2016 as Revenue Surges." The article went on to note expectations that Uber would lose $3 billion in 2016, on top of a $2 billion loss in 2015.
More intriguing to transportation analysts was the detail that Lyft enabled 160 million rides in 2016, generated $700 million in sales, and lost approximately $3.75 per ride. Let's stir in some additional data guesstimates and see what messages one might discern. A service called Sherpashare that tracks TNC data estimated that the average cost per TNC trip was $12.53 for Lyft from January to May of 2015. We know there is a base fare, and a booking fee, and a minimum fare, and a cancellation fee, and also a distance and time cost and maybe some tips or bonus/guarantee revenue. Based on looking at rates in several cities one might discern that an average trip was in the neighborhood of 8 miles in length. For context, the National Household Travel Survey indicates urban auto trips less than 50 miles average approximately seven miles in length with an average speed of 25 mph.
So what might this mean? The traveler appears to be paying approximately a $1.50 per mile for their trip, and if the loss per trip estimate is accurate, the investors are kicking in an additional $.50 per mile in subsidy.
Another website, Glassdoor, suggests compensation per hour for Lyft drivers averages in the mid-to upper teens. Let's say an operator collects $17.50 per hour. Let's assume they traveled 20 miles in an hour—part of that time with passengers and part without. If compensated at 80 percent of gross fares, that would mean drivers would be serving 1.75 trips per hour and have a passenger in the car about 70 percent of the time. Assume that the car operating cost is less than the IRS derived $.54 per mile. Let's assume drivers shop smart and buy reliable vehicles where the high initial depreciation is borne by somebody else. Let's say their marginal cost and depreciation are $.40 per mile. So that gross $17.50 per hour nets out to about $9.50 per hour—an amount at or below the minimum wage in several strong TNC market states.
Transportation analysts are interested in understanding how viable this business model will be going forward. Is it expandable and financially sustainable and can it be scaled up to play a more significant role in mobility, beyond its current role as a convenient, niche complement to the existing portfolio of mobility options? One wonders if TNCs will be able to continue to deliver service at an attractive price three to five years or more in the future. If people sell their cars and commit to using public transit and mobility services for urban trips, will the service be there when they need it, and at what price?
Part of today's cost structure, which has led to the large losses described earlier, can be attributed to startup costs but analysts wonder what costs will ultimately need to be passed on to consumers or absorbed by efficiencies. Similarly, what costs will have to be born by consumers to enable profit levels to justify desired equity valuations?
The past and potentially continuing pricing dynamics give rise to questions about what the demand curve for transportation network companies' services will be. What would be the demand for TNC rides if prices were 30 percent or 60 percent or 100 percent higher than they are today? If today's losses were covered by customers in fares and the company needed to make a profit and operator compensation needed to increase to provide a reliable workforce, one could speculate on prices 100 percent or more higher. What would happen to the price structure and business model if drivers were determined by the courts to be employees and not independent operators? How would the business model be impacted if future lawsuits result in drug test requirements for TNC drivers in an era of marijuana legalization?
What is the potential capacity of the TNC industry? Clearly, increasing ride pooling or ridesharing TNC trips will increase capacity and reduce traveler costs, but to play a more meaningful role in mobility, substantial increases in TNC capacity will be required.
The TNC labor force is unique in many ways. There appears to be a very high turnover rate among drivers, and the vast majority of drivers indicate that it's a second job. In talking with drivers, it's obvious that some of their motivations go beyond compensation. Some seem comfortable with, in effect, cashing in some of their vehicle equity as it depreciates in TNC service for cash flow at a particular point in their life. Numerous operators appear to be motivated to drive, because they enjoy customer service and interacting with people. There will always be some share of the population willing to drive for TNCs given the current economic formula, but we don't know how the supply of drivers could ramp up in an environment with additional demand. What financial compensation would be required to double or triple or support a five- or ten-fold increase in the number of TNC drivers in a given community? A recently released research report from SHARESPOST talks about a 10-fold increase in overall market potential for TNC companies in the next decade. Uber recently noted that even in their largest, most successful markets, they are providing less than 1 percent of the trips—less than transit or walking, maybe less than biking. What driver workforce requirements would there be if 5 percent of urban trips relied on transportation network companies?
In addition to concerns about industry capacity and the ability of TNC service to play a more meaningful role in mobility, transportation planners are interested in understanding the impact of TNCs on transportation system operations. That would include understanding the net impact on public transit systems and roadway congestion. In addition, understanding impacts requires knowing the net (net of the driver) passenger miles of mobility per vehicle mile of TNC travel including travel to and from market areas and between engagements. Related to this, what level of vehicle occupancy would be required for TNC services to have a neutral impact on roadway volumes relative to personal vehicle use or relative to prior means of travel (composite of changes in walk, transit, drive, bike, auto passenger, and previously forgone trips)?
The emergence of smartphones, logistics software, and the ability to use these technological advancements to support TNC and other mobility services, will have profound impacts on transportation in ways that we are just beginning to understand. These impacts will grow when self-driving vehicles are widely deployed. But the path forward is hardly clear. Transportation of people is a challenging business. It's not just a network optimization problem. Operating in the real world with real people brings a host of uncertainties and irregularities that make providing passenger services challenging. Transportation analysts and planners will be watching closely as data emerge and the full impact and consequences of emerging technologies on transportation become more apparent. Traditional data sources will begin to lend insight into TNC use freeing us from reliance on cannibalized financial data. For example, the 2016–17 National Household Travel Survey, now being conducted by USDOT, will capture data on TNC use and query respondents in the 129,000 household survey about TNC use. Though the tiny market share and modest national sample will impact the ability to tabulate this information with various other travel characteristics, it will help to add insight and perspective as will ongoing targeted surveys of TNC travelers. The growing body of knowledge will help frame the policy issues and decisions that policy makers will need to make to accommodate and shape the path forward for both current and emerging modes.
It's exciting and promising, but it sure makes it difficult to plan.
The comments are those of the author and are intended to provoke reflection. They do not reflect the policy positions of any associated entities or clients. In the absence of verifiable available data, numerous assumptions and estimates were made to formulate the following discussion. Inevitably some of these estimates will not match actual data. Apologies in advance – I'd be delighted to update if additional data is made available. [email protected].

Planetizen Federal Action Tracker
A weekly monitor of how Trump’s orders and actions are impacting planners and planning in America.
Map: Where Senate Republicans Want to Sell Your Public Lands
For public land advocates, the Senate Republicans’ proposal to sell millions of acres of public land in the West is “the biggest fight of their careers.”
Restaurant Patios Were a Pandemic Win — Why Were They so Hard to Keep?
Social distancing requirements and changes in travel patterns prompted cities to pilot new uses for street and sidewalk space. Then it got complicated.

Platform Pilsner: Vancouver Transit Agency Releases... a Beer?
TransLink will receive a portion of every sale of the four-pack.

Toronto Weighs Cheaper Transit, Parking Hikes for Major Events
Special event rates would take effect during large festivals, sports games and concerts to ‘discourage driving, manage congestion and free up space for transit.”

Berlin to Consider Car-Free Zone Larger Than Manhattan
The area bound by the 22-mile Ringbahn would still allow 12 uses of a private automobile per year per person, and several other exemptions.
Urban Design for Planners 1: Software Tools
This six-course series explores essential urban design concepts using open source software and equips planners with the tools they need to participate fully in the urban design process.
Planning for Universal Design
Learn the tools for implementing Universal Design in planning regulations.
Heyer Gruel & Associates PA
JM Goldson LLC
Custer County Colorado
City of Camden Redevelopment Agency
City of Astoria
Transportation Research & Education Center (TREC) at Portland State University
Camden Redevelopment Agency
City of Claremont
Municipality of Princeton (NJ)


