The University of Michigan Transportation Research Institute released its eighth report on peak motorization in the U.S., an evaluation of time spent traveling for a broad category of purposes, not just work. From 2004 to 2014, total time decreased.

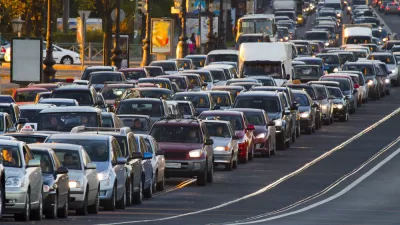
If you were to take at face value the August 26 Urban Mobility Scorecard prepared by the Texas A&M Transportation Institute (TTI) and INRIX, you'd believe that congestion is worsening throughout the United States, and a good reason to lay more asphalt. Of course, as Planetizen blogger Todd Litman explains here and here, that's hardly the case.
The supposed congestion plaguing American cities also belies the findings of the "Peak Motorization" report from the University of Michigan Transportation Research Institute (UMTRI) released September 1. This report evaluated how much time we spent traveling.
Researcher Michael Sivak evaluates two years only: 2004, the year he previously determined had the highest vehicle miles traveled per capita [PDF], and 2014, the latest year for which data is available from the American Time Use Survey prepared by the Bureau of Labor Statistics—"a representative nationwide survey of how, where, and with whom Americans spend their time."
The tables report trip times for ten categories of trips—for eating, education, work, etc., far different than the one category evaluated by TTI. From the report:
Activities for which average travel time decreased included eating and drinking (from 0.13 hours to 0.10 hours), purchasing goods and services (from 0.30 hours to 0.27 hours), caring for and helping nonhousehold members (from 0.08 hours to 0.05 hours), work (from 0.28 hours to 0.27 hours), education (from 0.04 hours to 0.03 hours), and leisure and sports (from 0.23 hours to 0.21 hours). (These values are for men and women combined.)
"The main implications of the present results are that the total travel time per person decreased substantially from 2004 to 2014," Sivak concludes. However, he adds, "that this decrease is due to a decrease in the proportion of persons engaged in the trips, and not an overall reduction of the duration of the trips."
Click here for a complete list of publications from UMTRI's Sustainable Worldwide Transportation.
FULL STORY: "Has motorization in the U.S. peaked? Part 8: Travel times in 2004 and 2014" [PDF]

Planetizen Federal Action Tracker
A weekly monitor of how Trump’s orders and actions are impacting planners and planning in America.

Chicago’s Ghost Rails
Just beneath the surface of the modern city lie the remnants of its expansive early 20th-century streetcar system.

San Antonio and Austin are Fusing Into one Massive Megaregion
The region spanning the two central Texas cities is growing fast, posing challenges for local infrastructure and water supplies.

Since Zion's Shuttles Went Electric “The Smog is Gone”
Visitors to Zion National Park can enjoy the canyon via the nation’s first fully electric park shuttle system.

Trump Distributing DOT Safety Funds at 1/10 Rate of Biden
Funds for Safe Streets and other transportation safety and equity programs are being held up by administrative reviews and conflicts with the Trump administration’s priorities.

German Cities Subsidize Taxis for Women Amid Wave of Violence
Free or low-cost taxi rides can help women navigate cities more safely, but critics say the programs don't address the root causes of violence against women.
Urban Design for Planners 1: Software Tools
This six-course series explores essential urban design concepts using open source software and equips planners with the tools they need to participate fully in the urban design process.
Planning for Universal Design
Learn the tools for implementing Universal Design in planning regulations.
planning NEXT
Appalachian Highlands Housing Partners
Mpact (founded as Rail~Volution)
City of Camden Redevelopment Agency
City of Astoria
City of Portland
City of Laramie


