


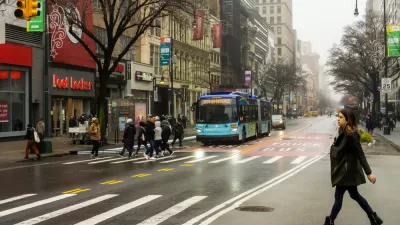
Anyone who uses a bike to navigate their city knows that every ride has stretches that are much more stressful than others. A new project collects data from brainwaves to map the stress levels of bikers in New York City.
Alex Davies writes about the MindRider Map, "which is created by deploying cyclists wearing a helmet that measures their brainwaves." The resulting map provides information on "like which route would be the most relaxing, and which the most demanding of your attention."
MindRider is the work of Arlene Ducao, who developed the technology behind the idea while a graduate student at MIT.
"The setup is simple: An off-the-shelf EEG brainwave sensor made by NeuroSky is built into a standard helmet. To make the map, eight riders spent September and October riding most of Manhattan (favoring north-south thoroughfares over east-west cross streets). Every second, the EEG sensor sends, via Bluetooth, data on the rider’s level of focus. Attention level rises when the user focuses on one thing (say, a car about to swerve into the bike lane), and decreases when they’re less focused."
The article goes on to detail some of the caveats related to the data collected conducted so far—like skewed perspectives generated by a limited pool of riders and the limitations of the off-the-shelf EEG sensor. But the potential of this kind of information, and this kind of research, is also tremendous for informing planners looking to improve bike infrastructure as well as bikers planner for the least stressful route.
FULL STORY: Measuring Brainwaves to Make a New Kind of Bike Map for NYC

Survey Says New Yorker Want More Protected Bike and Bus Lanes, Less Parking
A new survey reveals broad support for a less car-centric approach to capital investment in the city of New York.
Judge Halts Brooklyn Bike Lane Removal
Lawyers must prove the city was not acting “arbitrarily, capriciously, and illegally” in ordering the hasty removal.
NYC Launches ‘Smart Curbs’ Program
The pilot program on the Upper West Side will remove some curbside parking spots to replace them with public seating, bike racks, and delivery zones.

Planetizen Federal Action Tracker
A weekly monitor of how Trump’s orders and actions are impacting planners and planning in America.

Restaurant Patios Were a Pandemic Win — Why Were They so Hard to Keep?
Social distancing requirements and changes in travel patterns prompted cities to pilot new uses for street and sidewalk space. Then it got complicated.

Map: Where Senate Republicans Want to Sell Your Public Lands
For public land advocates, the Senate Republicans’ proposal to sell millions of acres of public land in the West is “the biggest fight of their careers.”

Maui's Vacation Rental Debate Turns Ugly
Verbal attacks, misinformation campaigns and fistfights plague a high-stakes debate to convert thousands of vacation rentals into long-term housing.

San Francisco Suspends Traffic Calming Amidst Record Deaths
Citing “a challenging fiscal landscape,” the city will cease the program on the heels of 42 traffic deaths, including 24 pedestrians.

California Homeless Arrests, Citations Spike After Ruling
An investigation reveals that anti-homeless actions increased up to 500% after Grants Pass v. Johnson — even in cities claiming no policy change.
Urban Design for Planners 1: Software Tools
This six-course series explores essential urban design concepts using open source software and equips planners with the tools they need to participate fully in the urban design process.
Planning for Universal Design
Learn the tools for implementing Universal Design in planning regulations.
Heyer Gruel & Associates PA
JM Goldson LLC
Custer County Colorado
City of Camden Redevelopment Agency
City of Astoria
Transportation Research & Education Center (TREC) at Portland State University
Camden Redevelopment Agency
City of Claremont
Municipality of Princeton (NJ)