


The following report surveys the current state of Internet technology as employed by the planning departments of over 500 cities in the United States.
This report benchmarks the use of technology in city planning departments across the United States as of October 2014, suggests gold standards for using technology in planning, and predicts how technology trends will impact planning departments in 2015-2016.
Emerging technologies are fundamentally changing how we plan, develop, and manage our urban areas. Planning professionals are increasingly being called on to adopt new technologies to plan, communicate planning concepts, and engage citizens in the planning process.
The set of technology tools that planning departments use to publish planning information has become increasingly well defined over the last several years. Most planning departments now publish the zoning code and general or comprehensive plan online. A smaller number provide sophisticated online geographic information systems.
However, other key aspects of public accessibility are less clearly defined. Examples of these metrics include whether the planning department's website is optimized for mobile and tablet devices, the reading level of the content, the use of social media, the frequency of website updates, online permitting, and more.
Methodology
We developed a subjective list of 12 key indicators for city planning departments and then evaluated the planning department websites of over 500 cities across the United States between May and July of 2014. This data was then aggregated to produce the findings of this benchmarking survey.
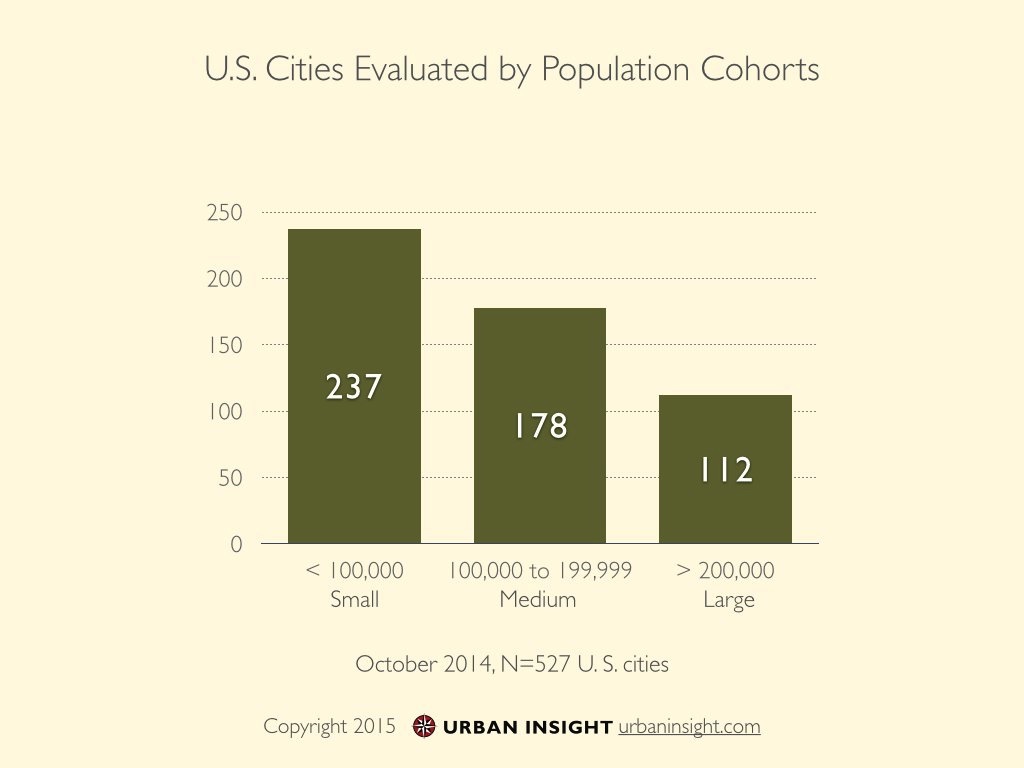
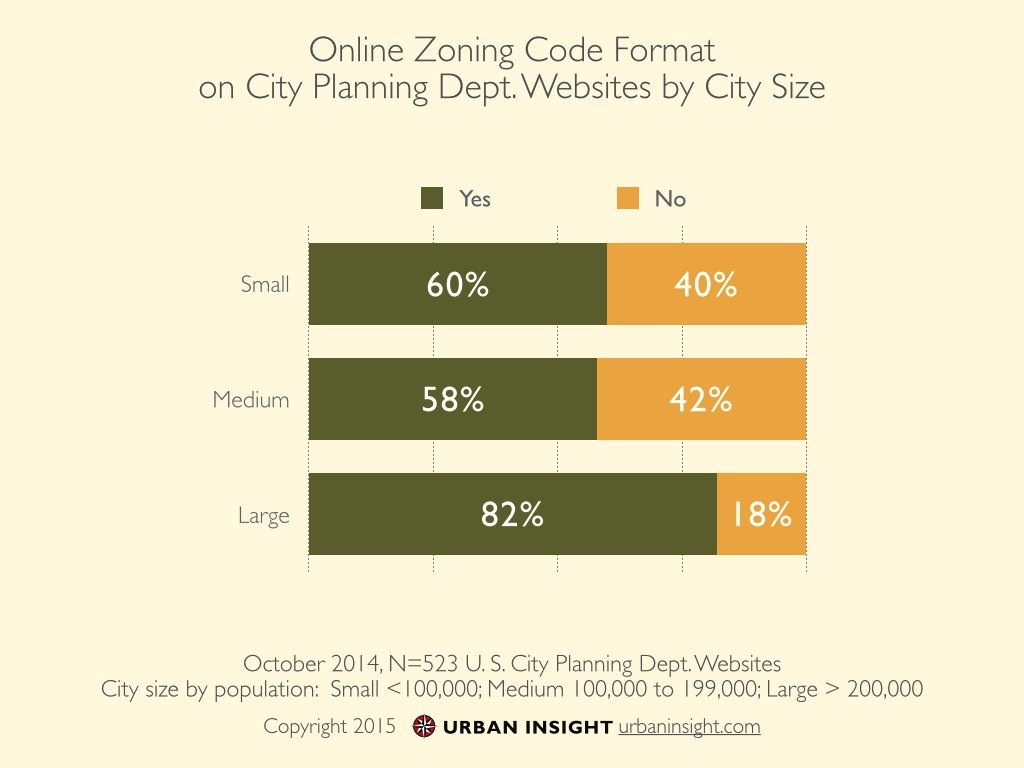
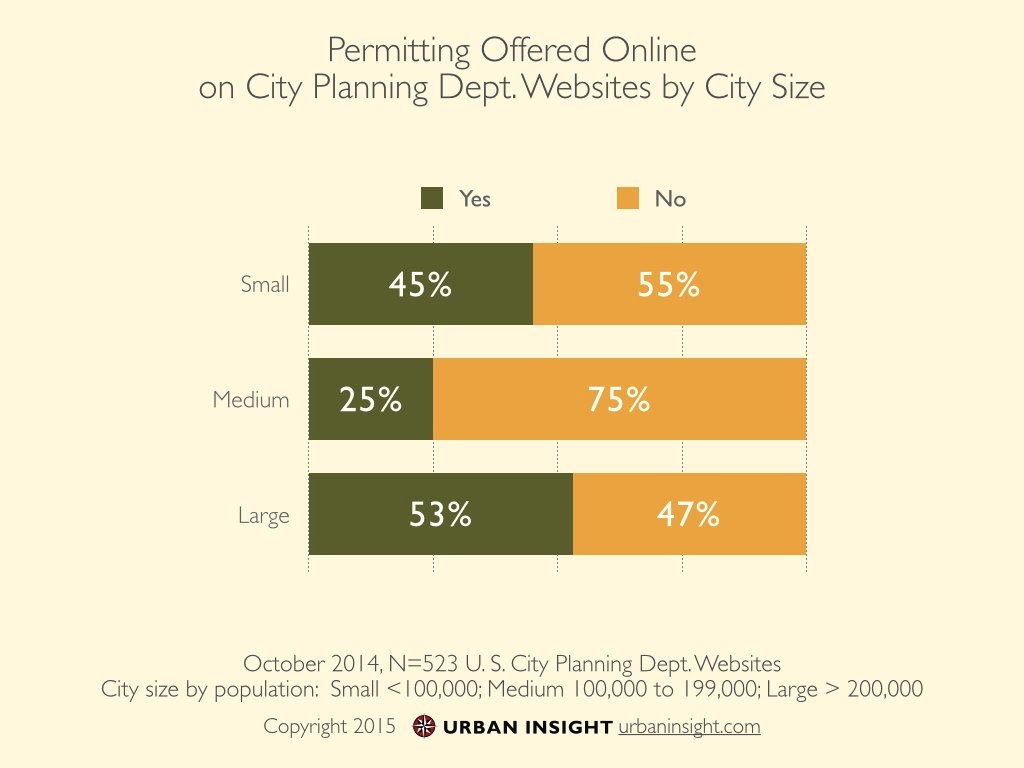
For the purpose of our analysis, we classify cities into cohorts for analysis. Cities with population less than 100,000 are classified as small, those between 100,000-199,000 as medium, and those greater than 200,000 as large.
For more information about our methodology, please see the full methodology in Appendix 1.
Findings
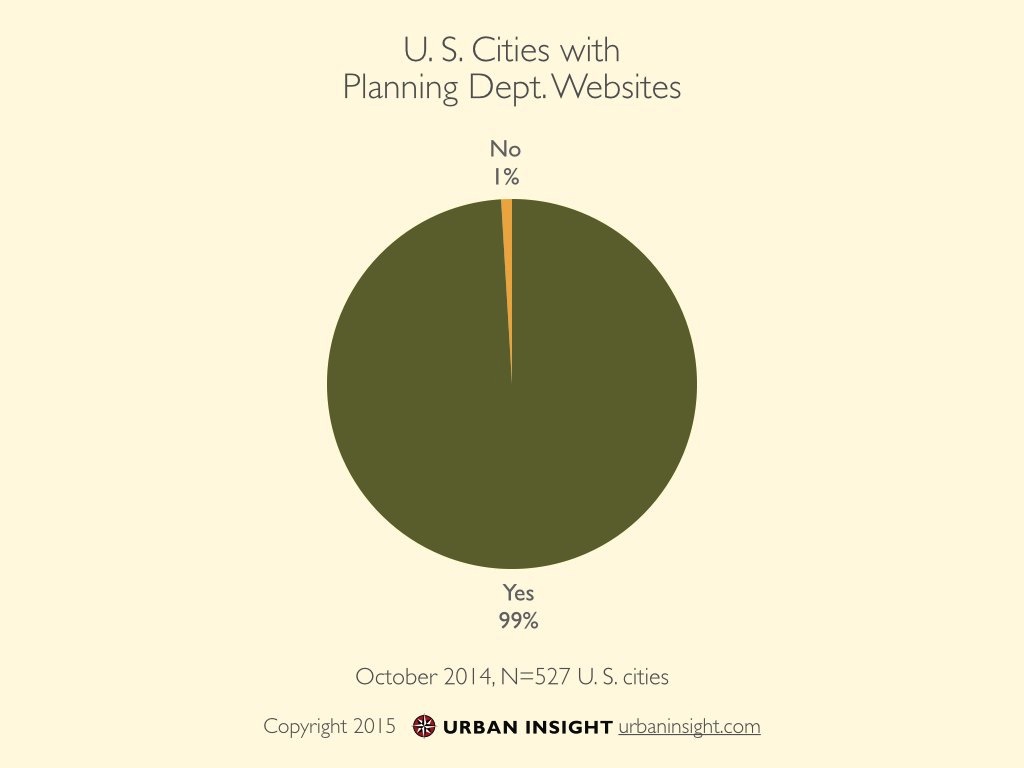
99 percent of city planning departments have a website
Of the 527 cities we evaluated, 523 (99 percent) had a dedicated page, collection of pages, or website for their planning department. The 1 percent of city planning departments without websites was excluded from further analysis.
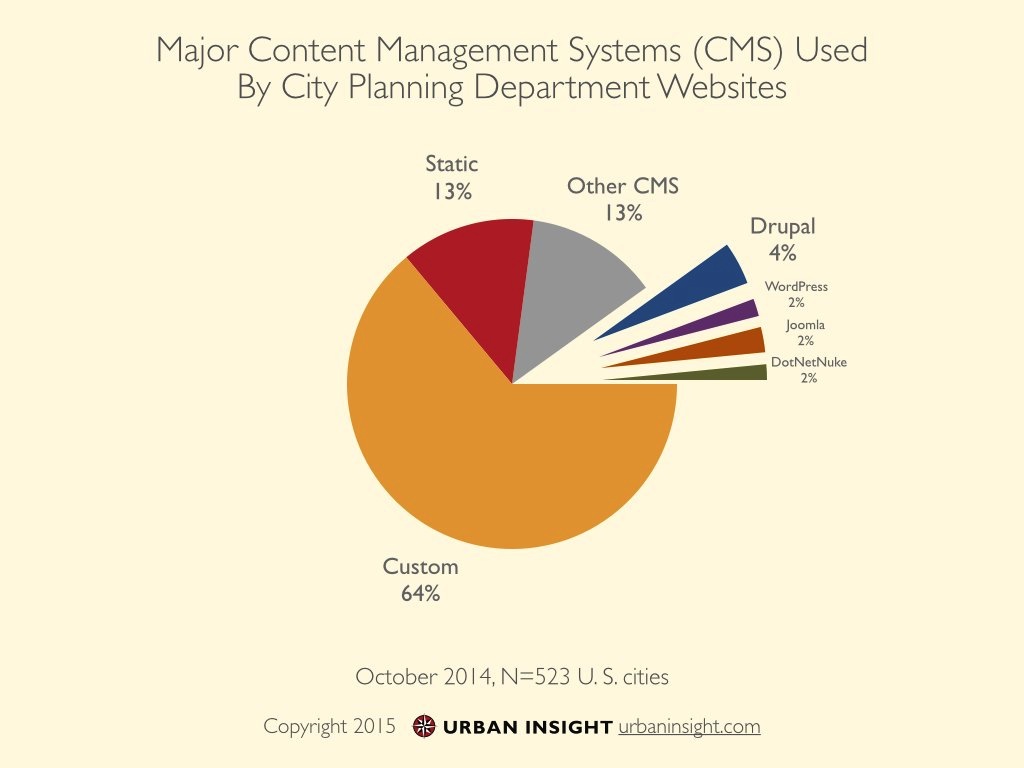
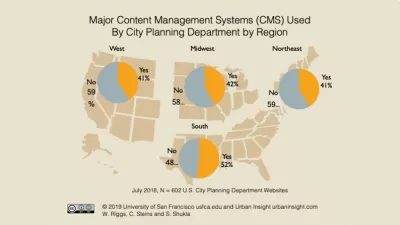
10 percent of city planning departments use a major web content management system
- The most common major content management system (CMS) used by city planning websites is Drupal (4 percent).
- Planning departments in cities with less than 200,000 residents are more likely to use a major CMS.
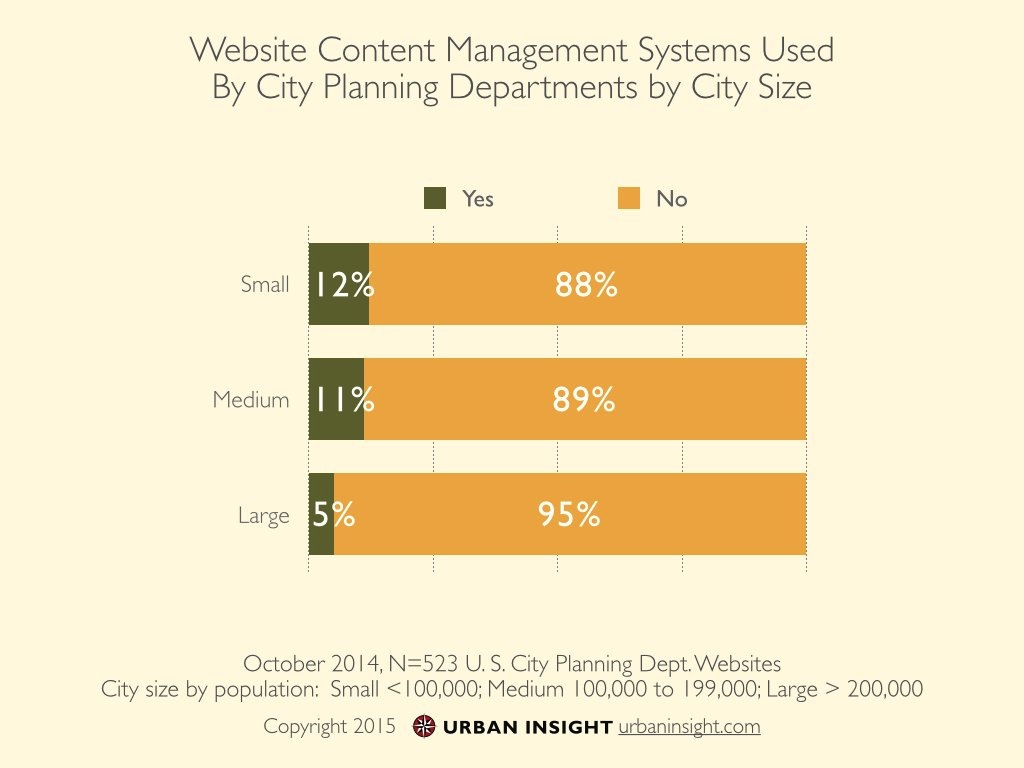
Modern web publishing uses content management systems to facilitate the process of publishing content. Years ago, in order to publish on the web, the author needed to have some programming abilities. Today, the trend is for websites to be built using content management systems, which separates the programming of the website from the ability to publish content. By using a content management system, authors can add, edit, and delete content and images on a website using a web interface.
We identified content management platforms used by planning department websites using the Wappalyzer tool (see Appendix 2, Tools).
Most (64 percent) city planning websites were custom-developed websites*. Another 23 percent of sites are using a content management system, including 10 percent using a major content management system such as Drupal, WordPress, Joomla, or DotNetNuke. Of those using a major content management system, the open source Drupal (4 percent) was the most popular.
A minority of sites (13 percent) were static, implying that the site was manually updated.
* It is possible that some of these 64 percent of custom city planning websites were using a content management system that we were unable to discern.
15 percent of city planning department websites use responsive design
- Planning departments in cities with a population over 200,000 are more likely to use responsive design.
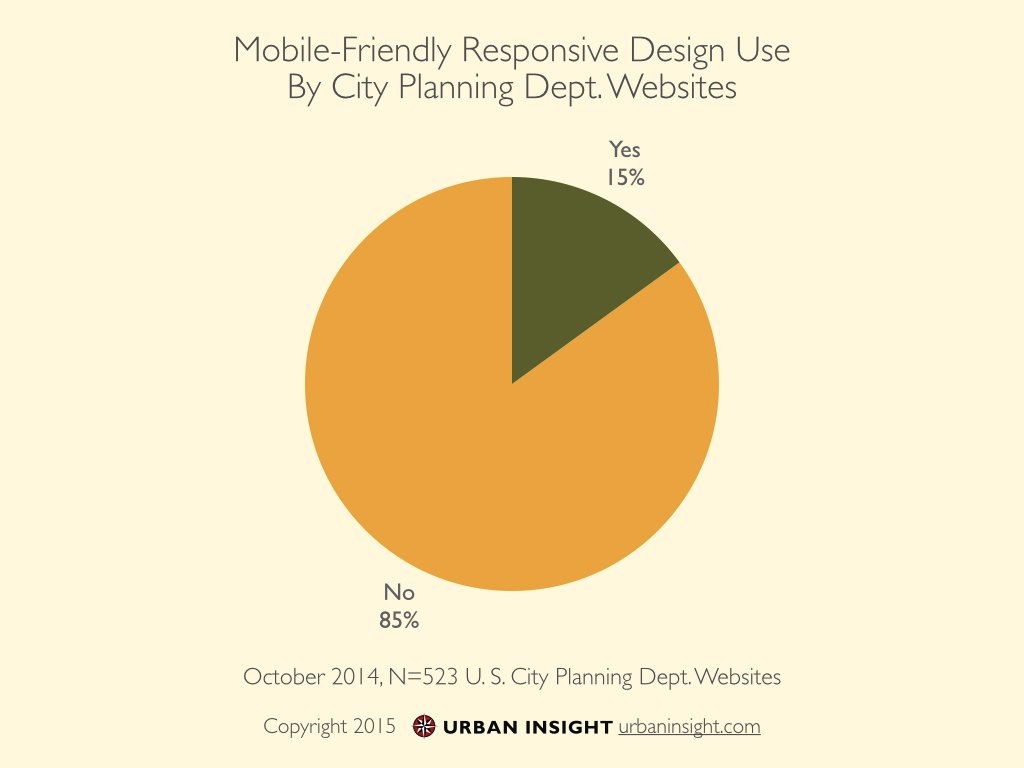
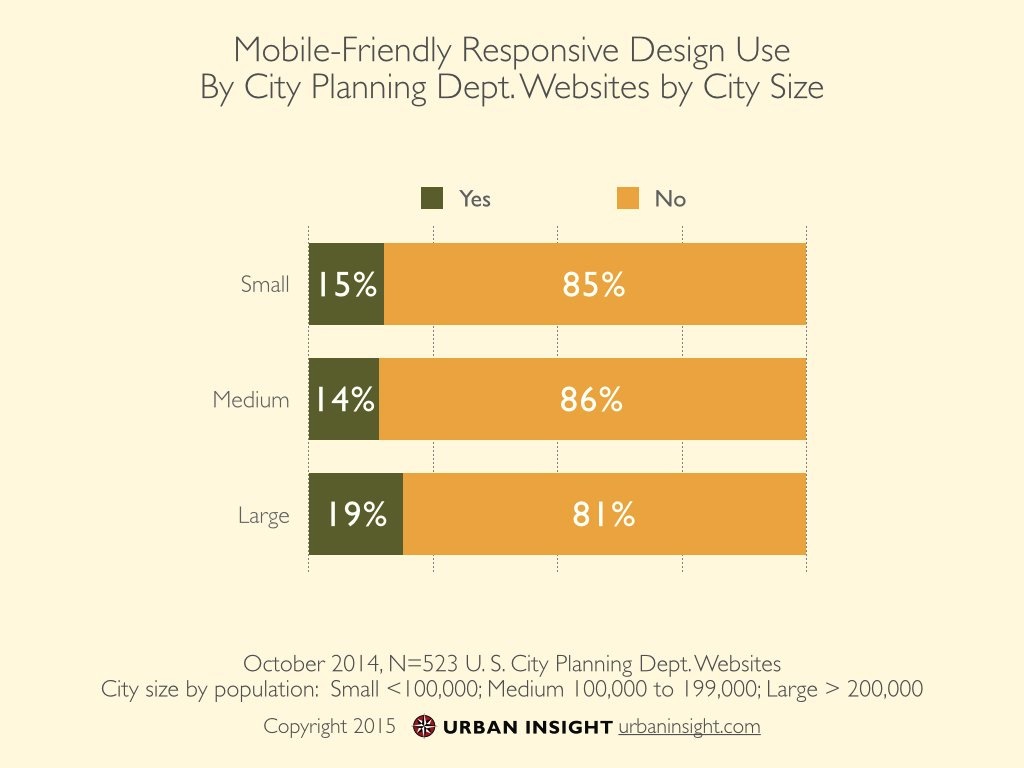
Traffic from mobile devices such as smartphones and tablets has growing quickly since 2011, now representing approximately 25 percent of all web traffic. Mobile computing will continue to accelerate; we predict more people will access the Internet via mobile phones and tablets than desktop computers by the end of 2015.
Responsive web design is the gold standard for building a website that adapts its presentation to the device on which it is being viewed. Responsive design has emerged as the preferred approach for building a single website that is accessible on multiple devices, from desktop computers to smartphones.
Of the 523 planning department websites we evaluated, 15 percent have adopted responsive web design techniques.
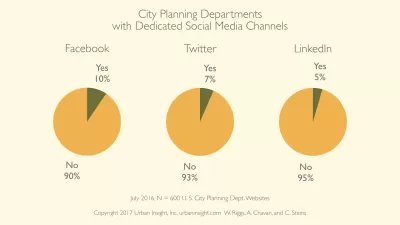
10 percent of city planning departments have dedicated social media channels
- Facebook is most popular (7 percent), followed by Twitter (6 percent) and LinkedIn (1 percent).
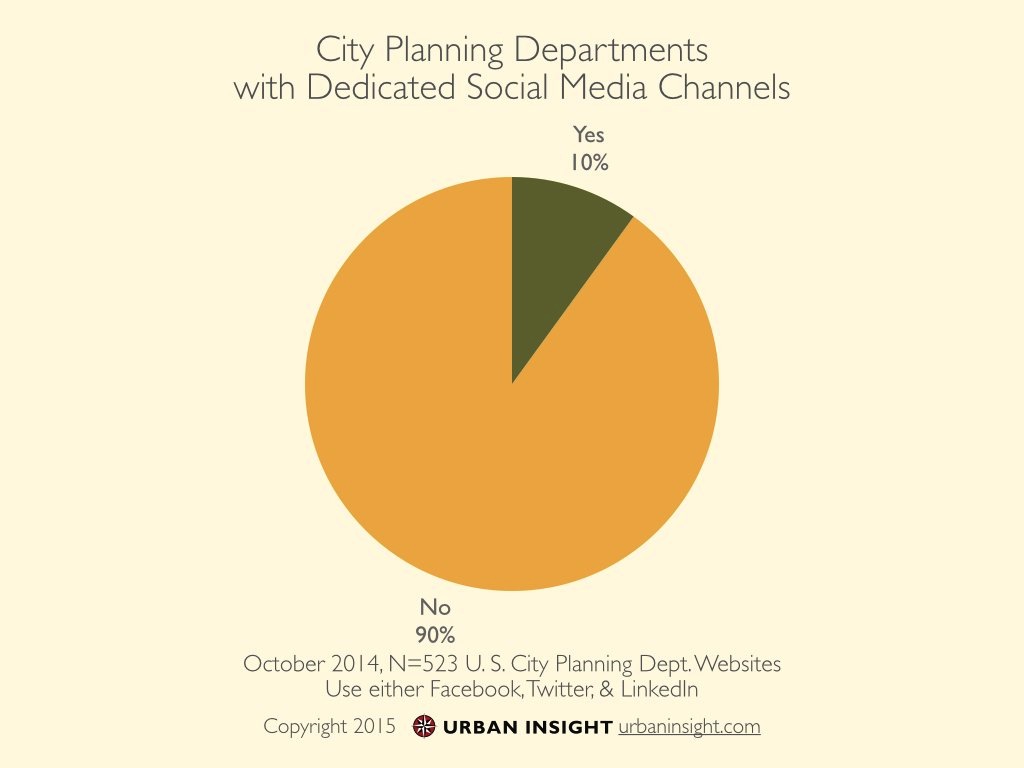
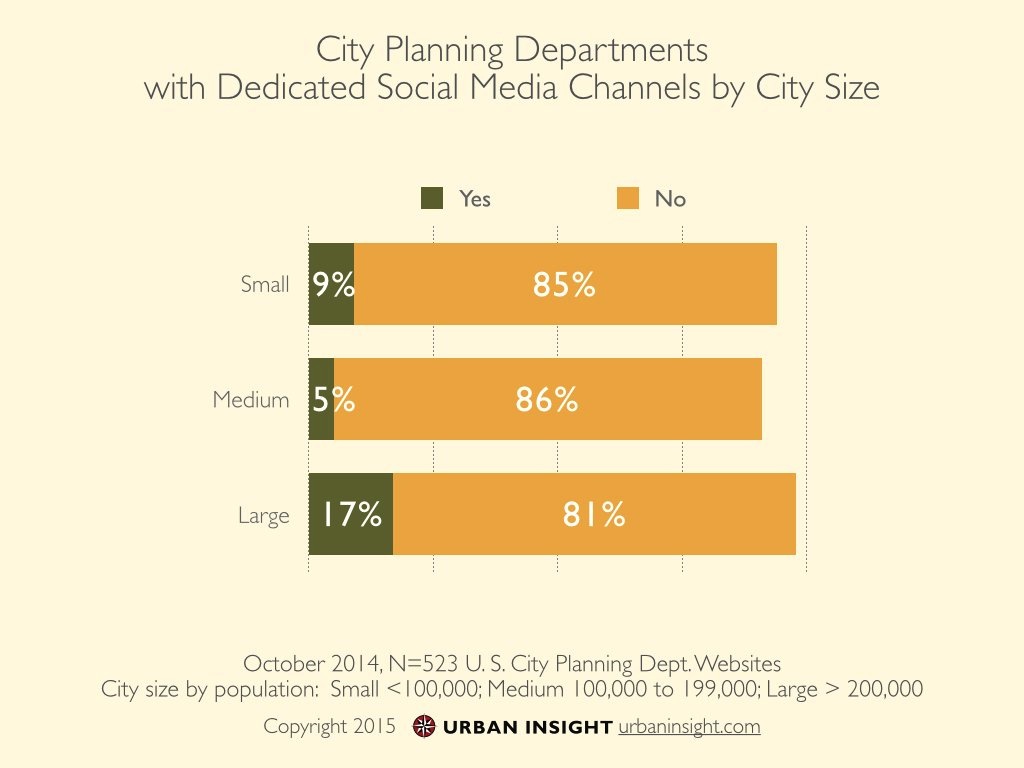
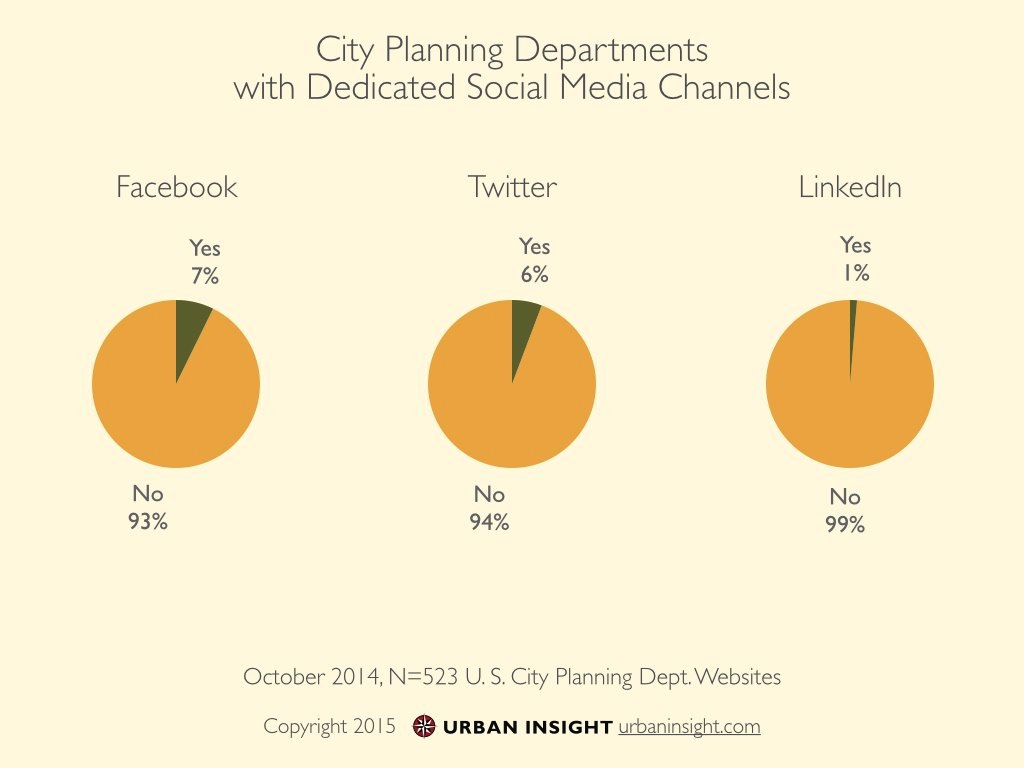
Use of social media sites such as Facebook, Twitter, and LinkedIn have gained popularity as another set of channels to communicate with stakeholders. We evaluated city planning departments to determine if they had set up a Facebook page, Twitter account, or LinkedIn group dedicated to the department.
Planning departments in cities with a population over 200,00 have been most active in adopting some form of social media site dedicated to planning.
We speculate that the increased use among larger cities also relates to how social media tools work suit the needs of complex urban organizations comprised of many divisions with varying needs. Also, the higher staffing levels of larger planning departments may be necessary to support social media efforts.
12 percent of city planning department web content is in PDF or Word format
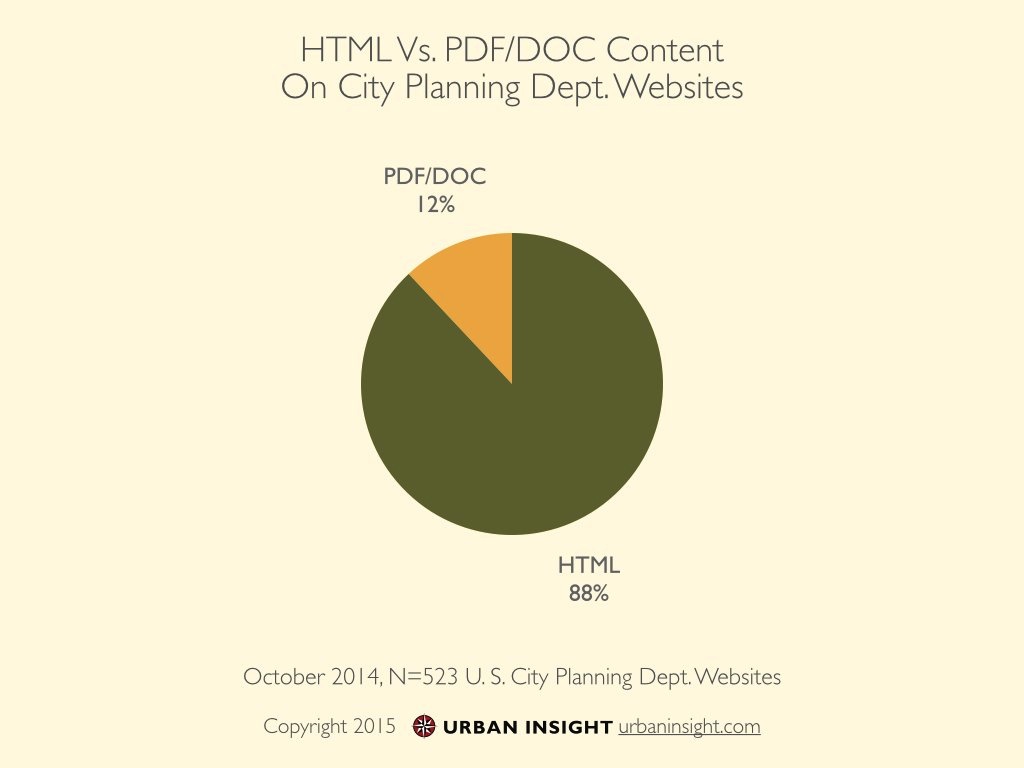
A lot of the Internet’s content is published in a format that appears as text in your web browser. That content is generally called HTML, regardless of the range of technologies used to deliver this content. However, it is also possible to provide content on the web using other formats, such as portable document format (PDF) or Microsoft Word (Word) formats. These non-HTML formats have their place, but are often inconvenient to read on mobile devices, difficult to search, and generally decrease usability of web content.
Using Google Advanced Search (see appendix 2, Tools) we determined that on average most city planning department websites have 12 percent or less of their content in PDF or Word format.
5 percent of city planning department content is at a basic reading level
- 85 percent of city planning department website content is written at an intermediate level.
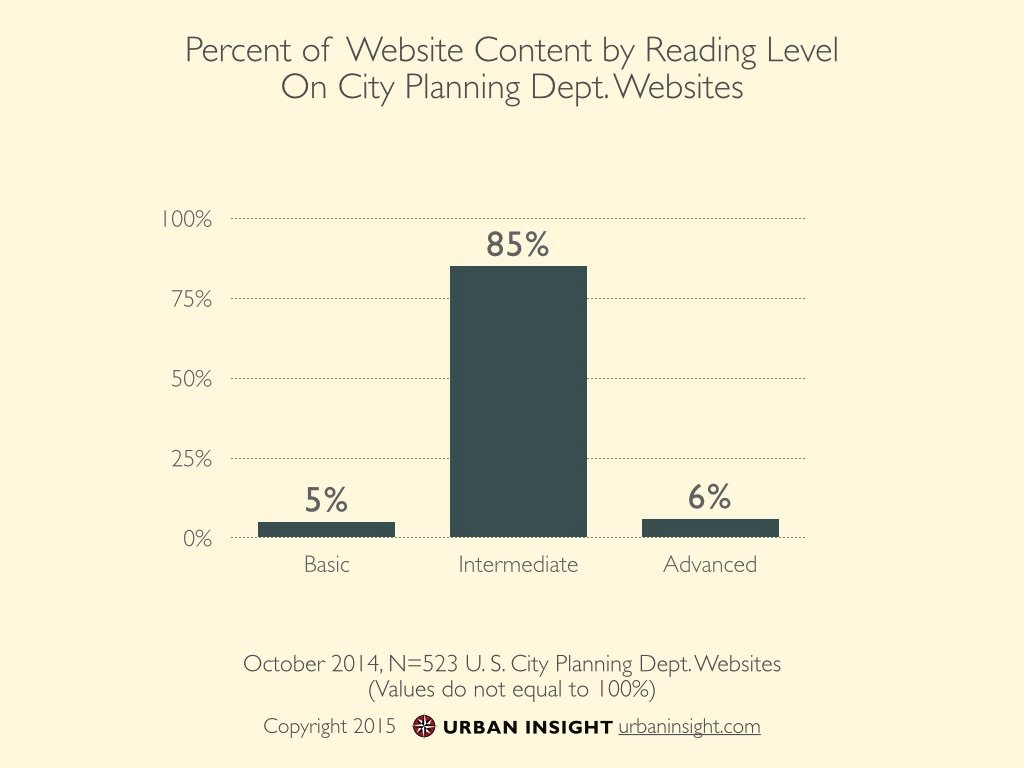
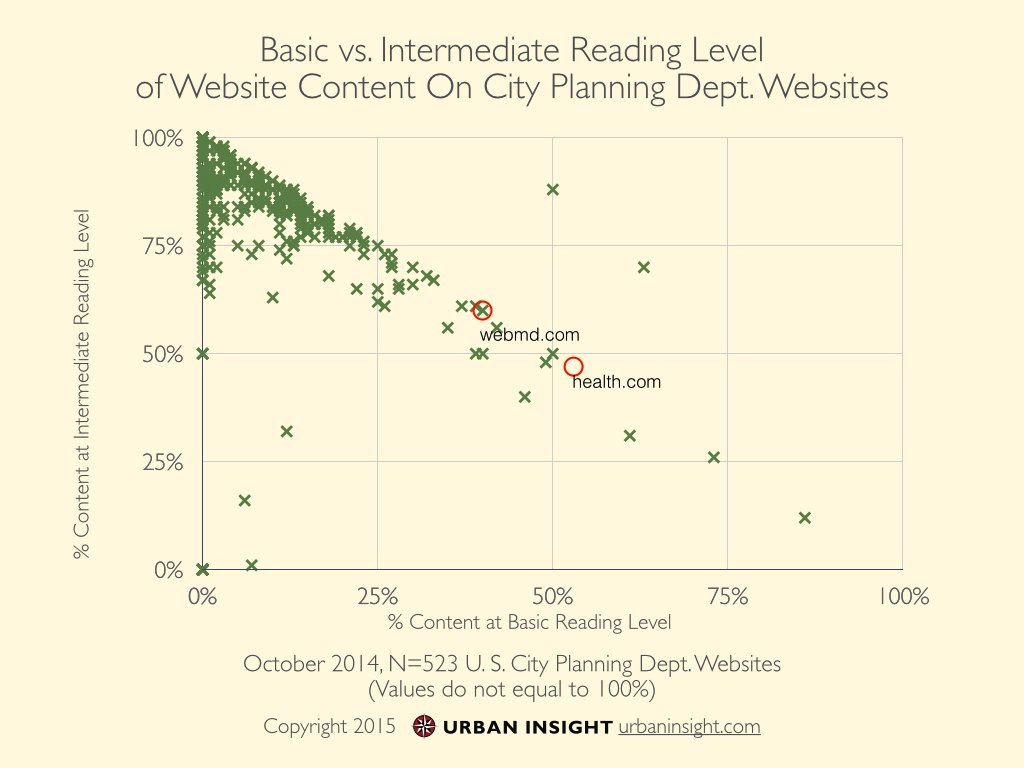
The level at which documents are written impacts the ease with which those documents can be read and understood. Using Google Advanced Search (see Tools) we determined the average for basic, intermediate, and advanced reading levels of content on city planning department websites.
Of the 523 websites we evaluated, 85 percent of the content is presented at an intermediate reading level, which matches the U.S. national average. Five percent of content is presented at a basic level, while 6 percent is at an advanced level.
According to usability expert Jakob Nielson, websites targeted toward the general public should aim to provide information at the 6th grade reading level.
By comparison, content on the health-related information website health.com is at 53 percent basic and 47 percent intermediate readability. Similarly, webmd.com content is at 40 percent basic and 60 percent intermediate readability.
83 percent of city planning departments offer their zoning code online
- 50 percent offer the zoning code in an HTML format.
- 33 percent of planning departments offer the zoning code as a PDF.
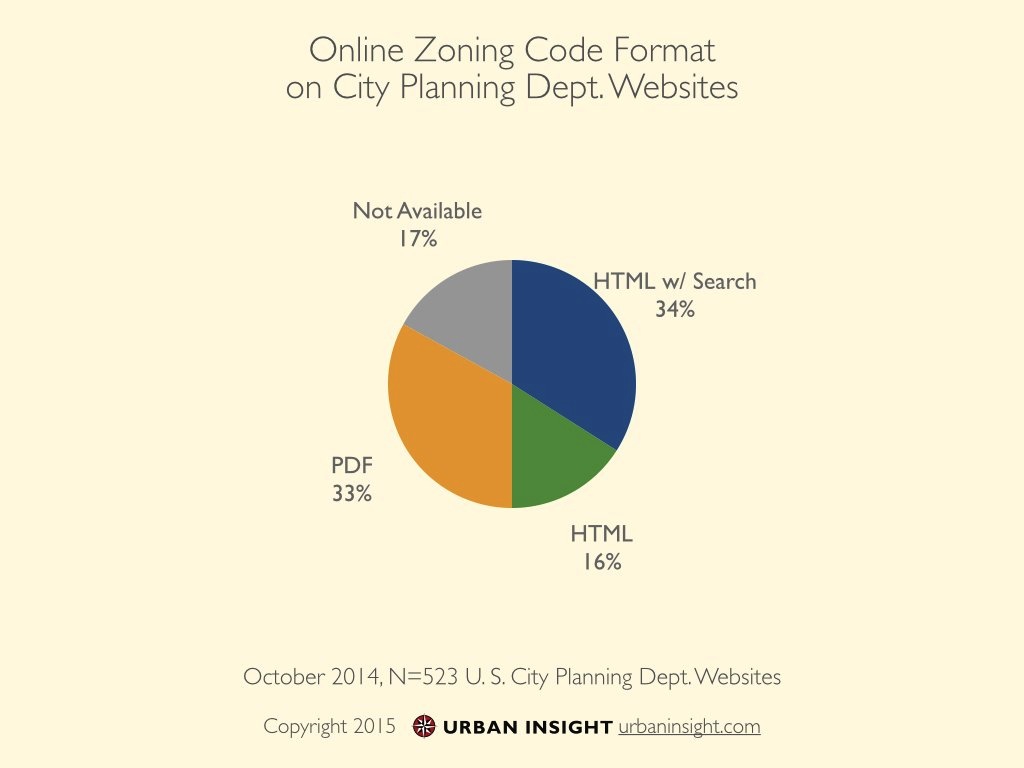
The authority to zone is central to the role of most planning departments. We evaluated whether cities maintained an online version of the zoning code, and the format in which the zoning code was presented.
The gold standard for zoning code usability is presented in HTML format, is mobile responsive, and is fully searchable. Zoning codes in portable document format (PDF) are generally less desirable, especially PDFs that have been scanned from printed documents, which typically renders the content of the zoning code unsearchable.
Of the 523 websites we evaluated, 83 percent of sites had the zoning code available in some format; 34 percent were verifiably searchable.
31 percent of cities self-publish their zoning code
- Among those that use a third-party system, Municode is the most popular (31 percent).
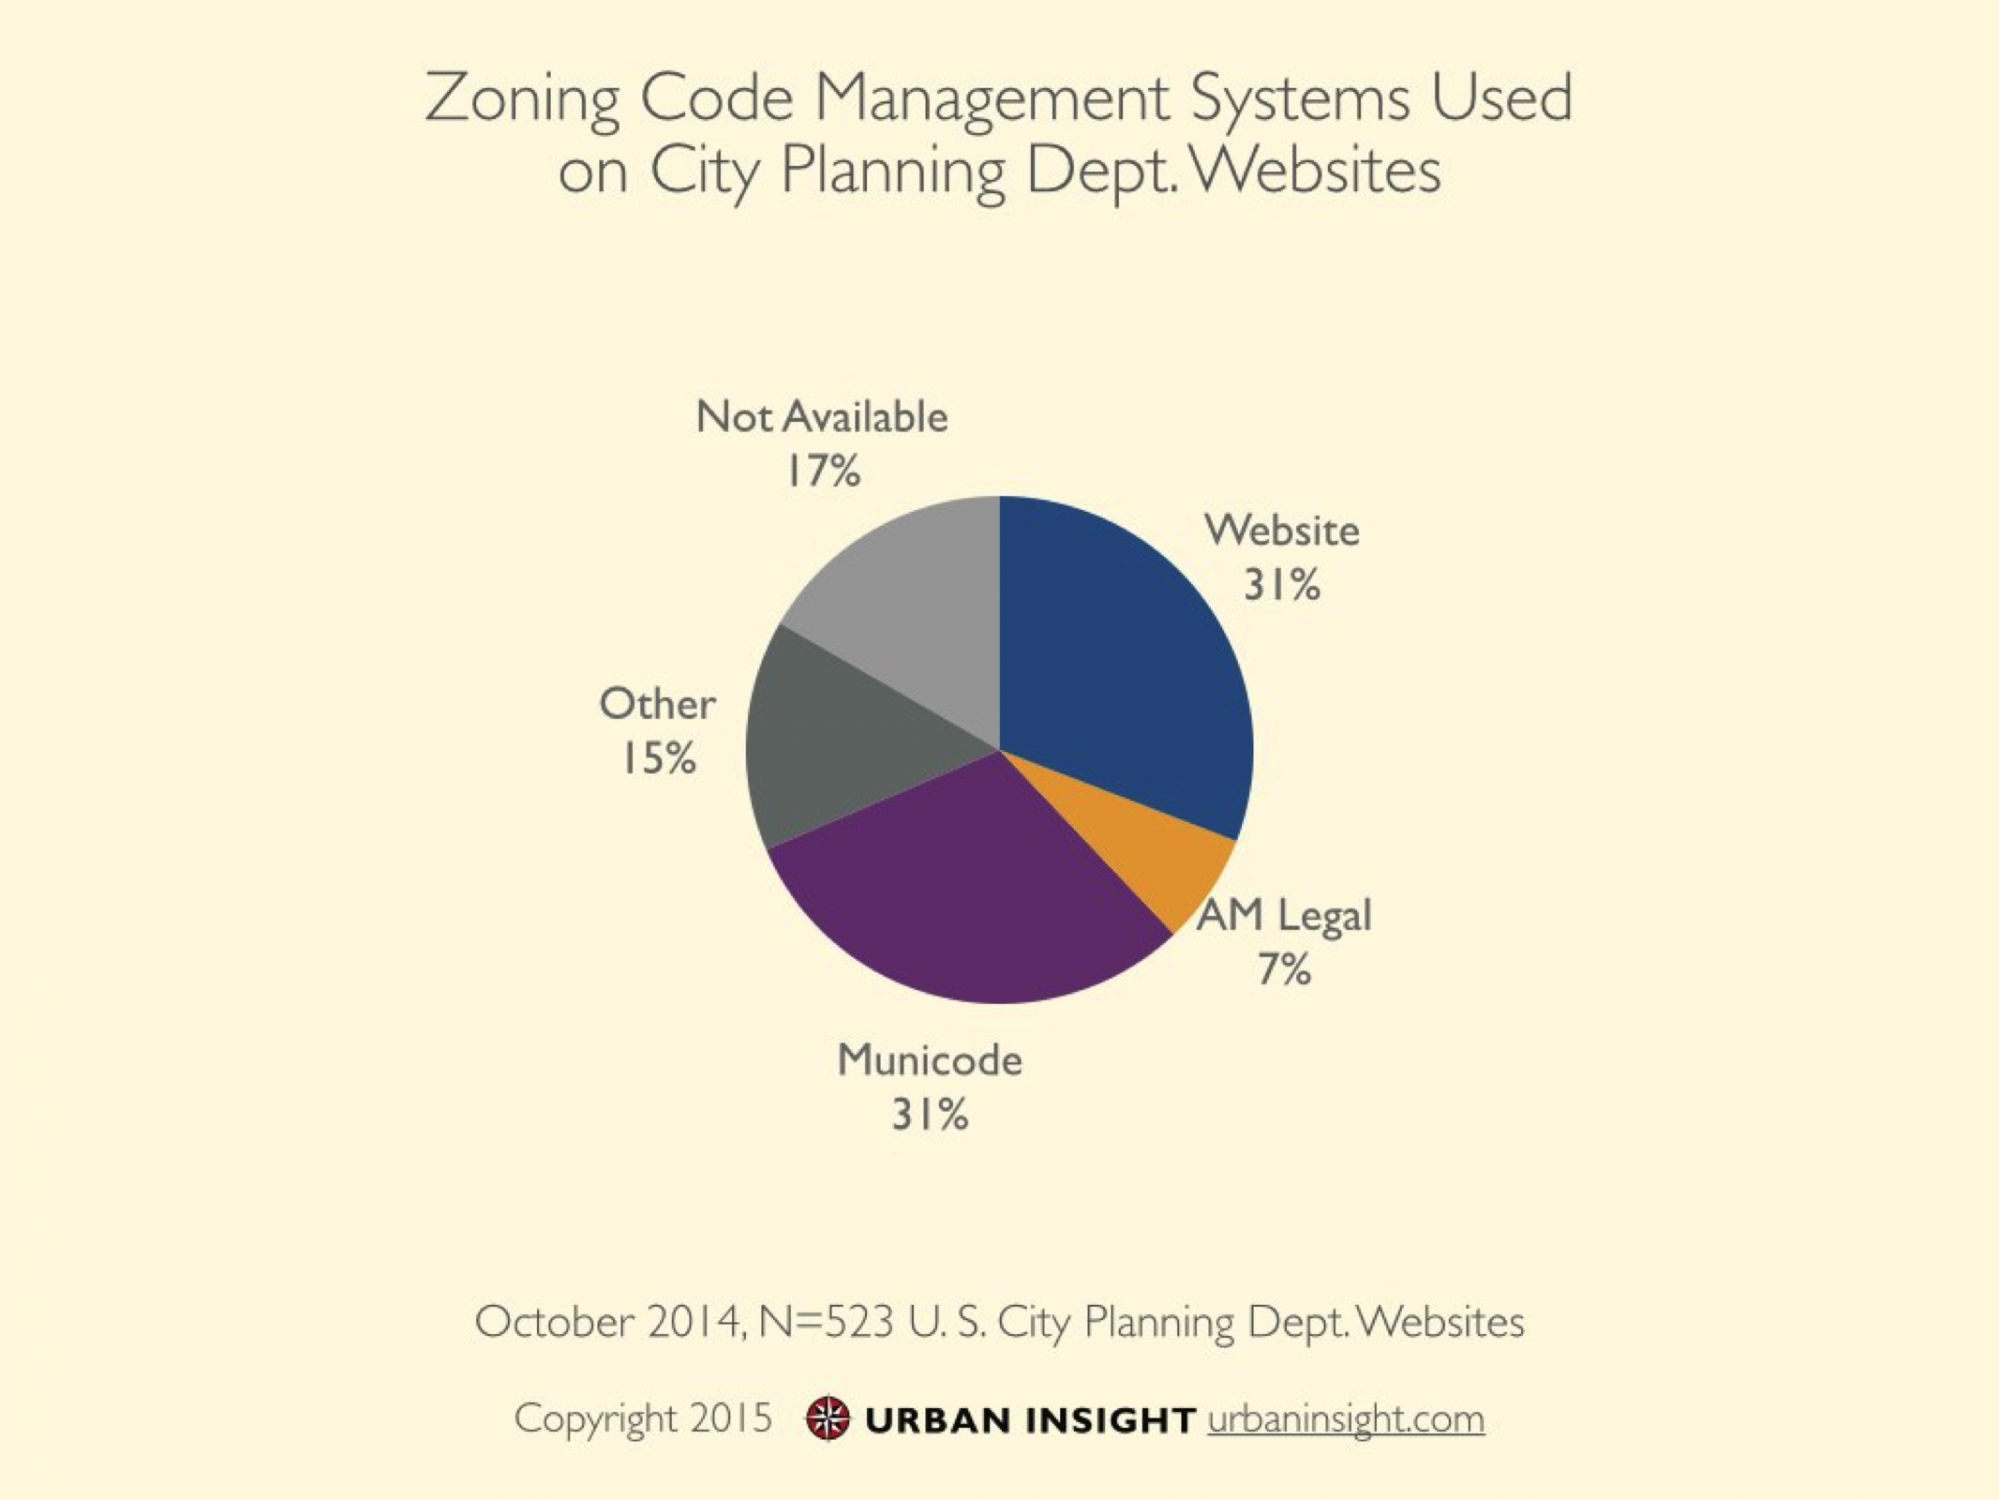
Zoning codes are typically complex documents that are updated on a monthly or annual basis. This complexity has resulted in a trend to outsource zoning code management to companies that provide management and publishing of municipal codes, or to publish the latest version of the document as a PDF.
However, as with the use of content management systems for web publishing, there appears to be emerging innovation in the development of software for cities to manage their own zoning code. For cities that offered the zoning code online, we evaluated how the zoning code was published.
Of the 523 websites we evaluated, 31 percent of cities that published the zoning code did so on the city’s website. Among cities that hosted their website somewhere else, the most popular service was Municode (31 percent), followed by the AM Legal service (7 percent).
21 percent of city planning departments do not offer their general plan online
- Publishing the general plan using PDF is the most common format (69 percent).
- 10 percent publish the general plan in HTML.
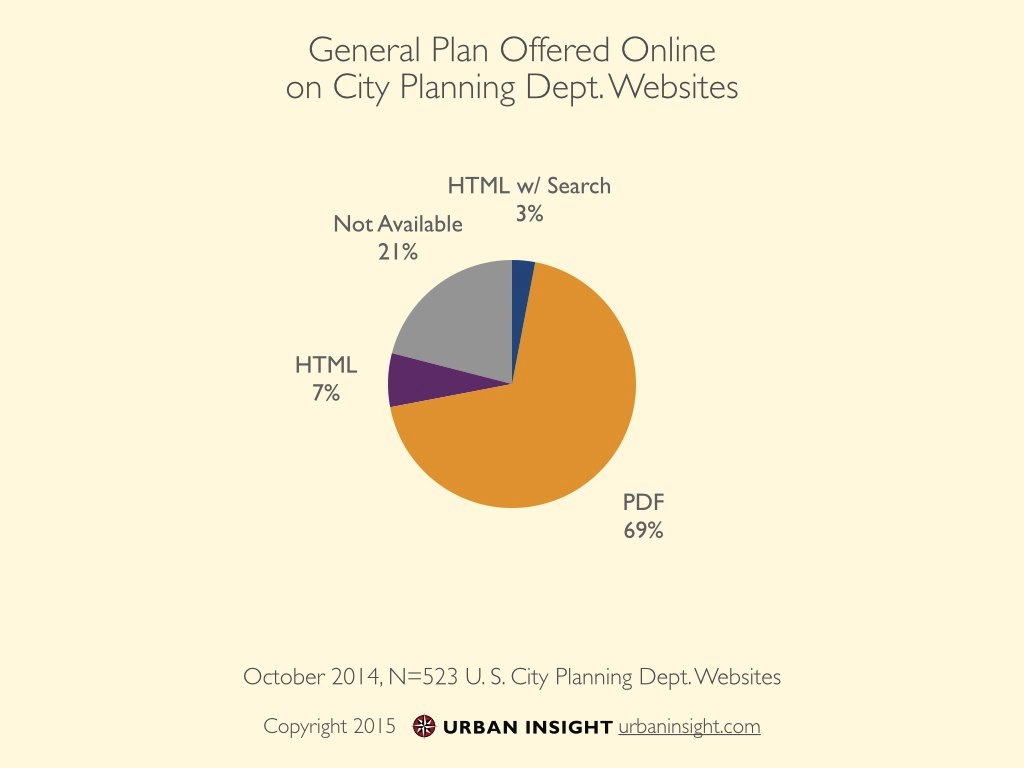
The general or comprehensive plan defines the range of acceptable land uses within a city. We evaluated whether the general plan was available on the planning department’s website as well as the format of the document.
As with zoning codes, the gold standard for general plan usability is presented in HTML format, is mobile responsive, and is fully searchable. General plans in portable document format (PDF) are generally less desirable.
Of the 523 city planning department websites we evaluated, 10 percent offered the general plan in an HTML format, including 3 percent that were also fully searchable. 69 percent of cities offered a PDF version of the document, while 21 percent did not offer the general or comprehensive plan online.
53 percent of city planning departments update their website at least monthly
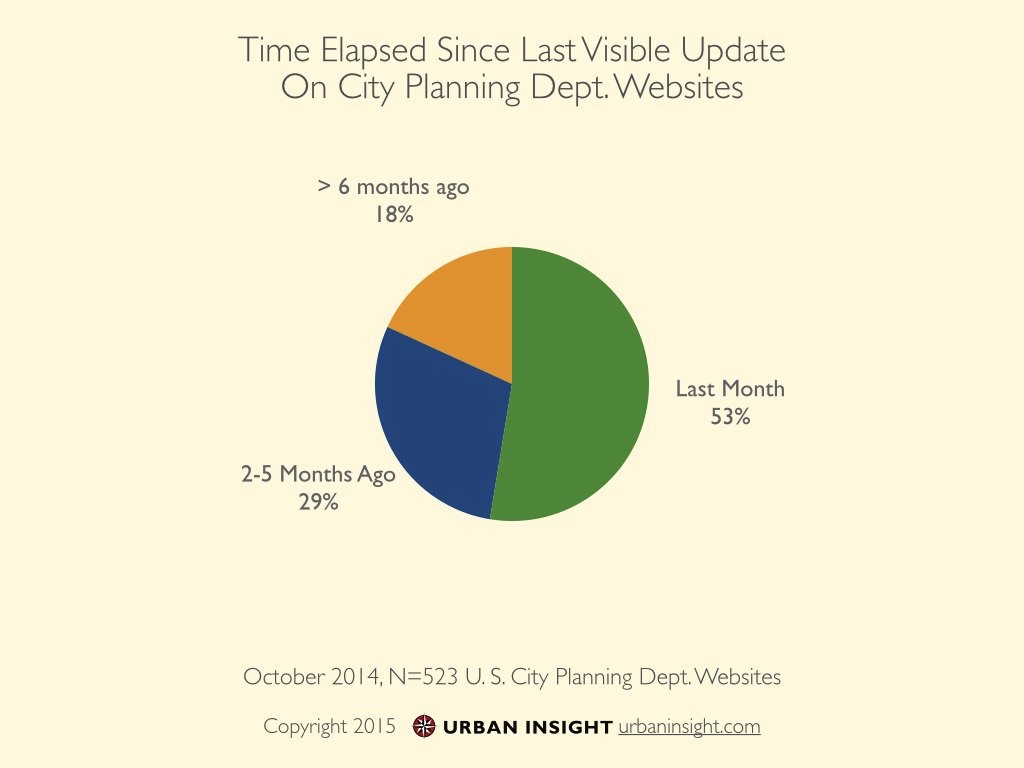
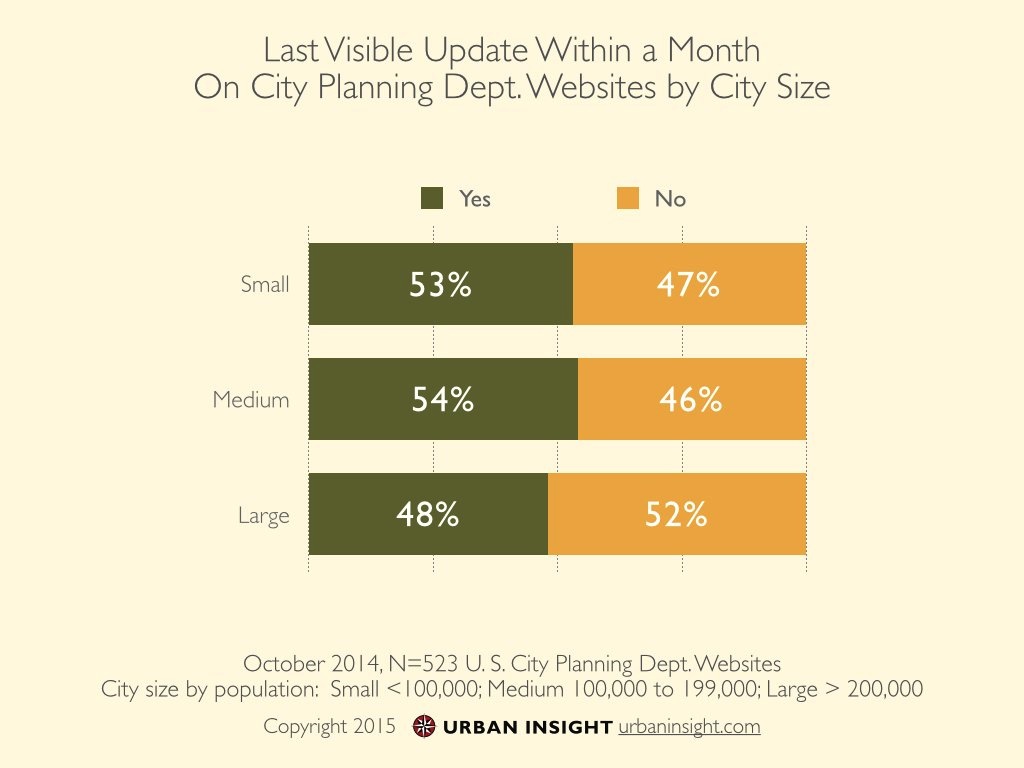
Published updates by the planning department about its activities can signal the department’s interest in engaging with the public. We evaluated city planning department websites to attempt to discover the last visible website updated performed by the department.
We found that 53 percent of city planning websites have been visibly updated within the last month. Another 29 percent had been visibly updated within the last two to five months, while 18 percent of the websites had not been visibly updated within the last six months.
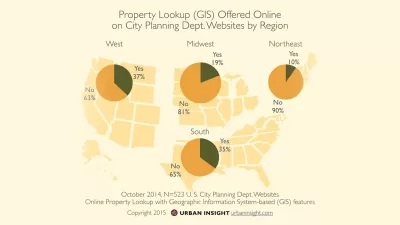
40 percent of cities offer online property lookups (GIS)
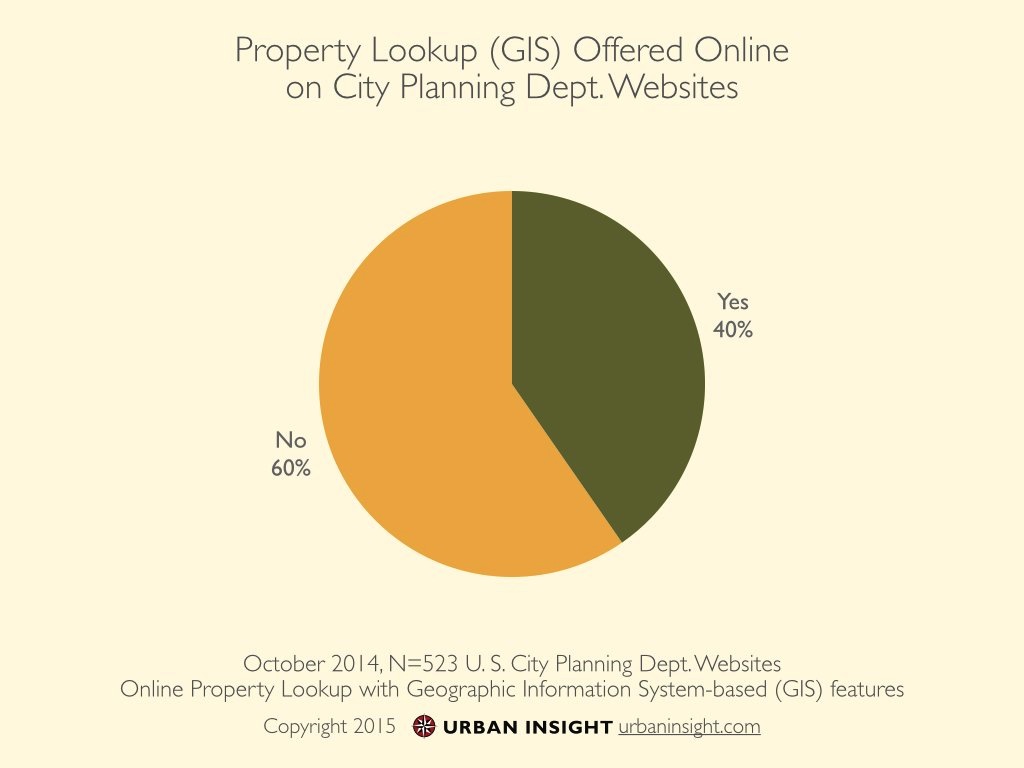
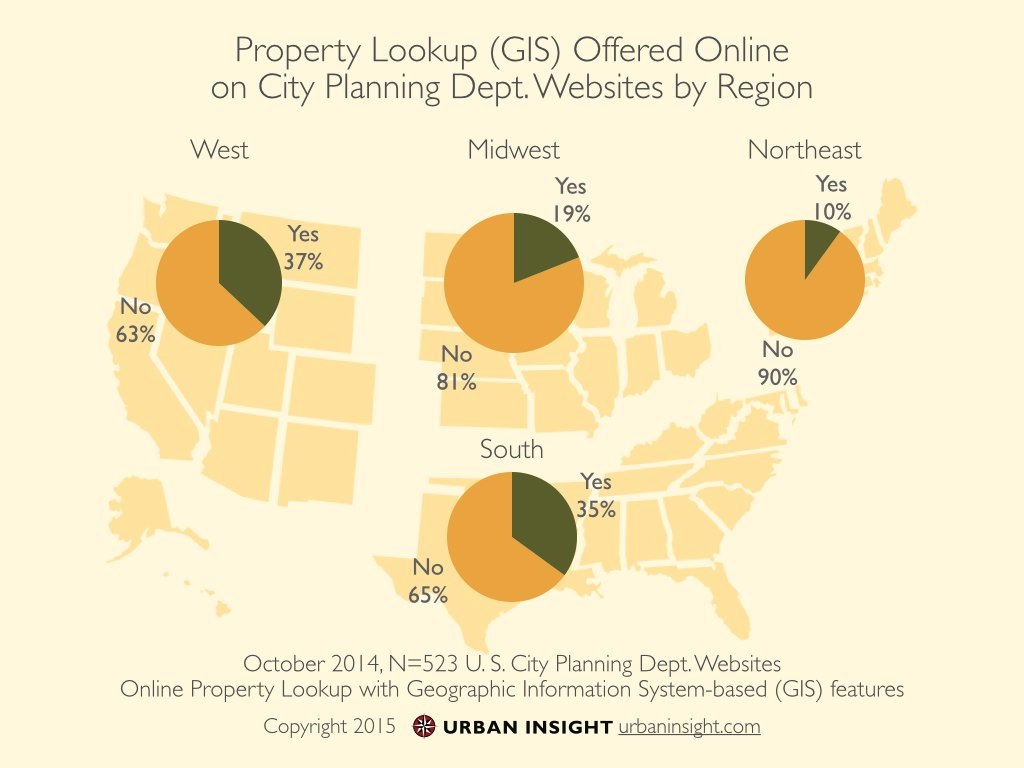
The ability to look up information about a specific property is often provided by the city, county, or other agency. However, the availability of parcel-level detail online is an indicator that the city has invested in a web-based geographic information system (GIS) and that the planning department has access to potentially sophisticated land use analysis and mapping capabilities.
For our analysis we evaluated if the planning department had offered, in some form, an online property lookup tool on its website. 40 percent of planning websites offered this feature, with higher adoption of these tools in the West (37 percent) and South (35 percent), and lower adoption in the Midwest (19 percent) and Northeast (10 percent).
The gold standard for an online property lookup is a web-based geographic information system that is mobile responsive, provides a user interface that is easy to learn for non-GIS professionals, and enables users to perform common searches, such as looking up a resident’s property, finding zoning information, and potentially identifying available properties to stimulate economic development.
We anticipate that online geographic information systems providing property lookup tools for cities will be a growth area for planning practice and technology companies.
21 percent of cities offer online permitting
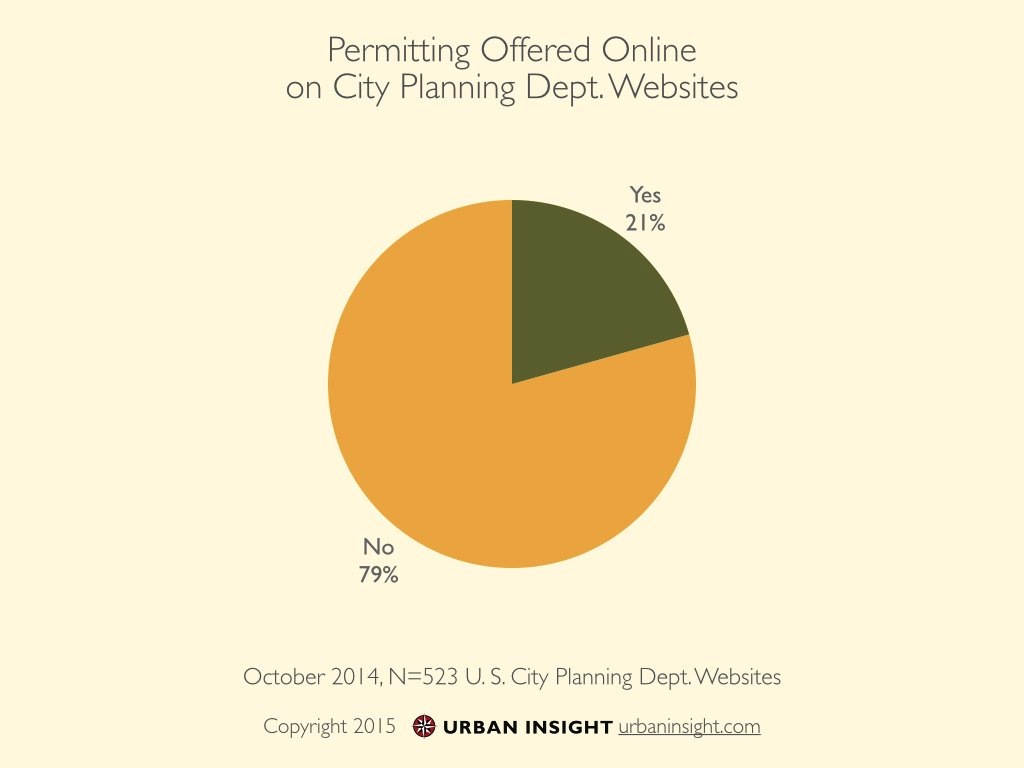
The authority of the planning or building department to issue permits for building or modifying structures is central to the role of most cities. Traditionally, permits are issued at the planning counter in a manual process. Emerging technologies and a broader reliance on e-commerce as an acceptable and desired alternative to face-to-face transactions are beginning to impact how planning departments perform permitting transactions.
We evaluated whether online permitting was available on the websites of the planning departments under study. The majority (79 percent) do not support online permitting. Of the 21 percent that do provide online permitting, there is greater adoption among smaller and larger cities, with less adoption among cities in the medium cohort (populations between 100,000 - 199,000).
We anticipate that this will be a growth area for cities and that we will see more opportunity for online transactions in the future.
Conclusions
Emerging technologies are fundamentally changing how we plan, develop, and manage our urban areas. Benchmarking which technologies are being used in city planning departments across the United States enables us to evaluate future trends.
Based on our evaluation of data collected in June 2014 and our familiarity with the use of technology to support city planning departments, we make the following observations about the use of web technologies in city planning departments:
- Expect to see dramatic increases in responsive design as mobile and tablet devices eclipse desktop computers as the primary means of viewing planning department content. If you are building a new website, be certain that it uses responsive design.
- The use of off-the-shelf content management systems will increase as websites are updated. Modern content management systems will aid in the frequency of website updates, and the best contemporary systems use responsive design natively.
- As the percentage of web traffic from smartphones and tablets continues to grow, it will become increasingly important for city planning department websites to convert information from PDF documents to HTML format, which is much easier to read on such devices.
- Adoption of online permitting systems and online geographic information systems will continue to increase as technologies to support these systems become more affordable and an increasing number of companies offer interesting solutions. However, implementing these technologies will remain out of the reach of many planning departments for several more years.
About the Authors
William (Billy) Riggs, PhD is an Assistant Professor of City & Regional Planning and a leader in the area of transportation planning and technology, having worked as a practicing planner and published widely in the area. He has over 50 publications and has had his work featured nationally by Dr. Richard Florida in The Atlantic. He is also the principal author of Planetizen's Planning Web Technology Benchmarking Project. He can be found on Twitter @williamwriggs.
Abhijeet Chavan is Chief Technology Officer of Urban Insight, a technology consulting firm based in Los Angeles, California. He is also a founding editor of Planetizen.
Chris Steins is Chief Executive Officer of Urban Insight, and a founding editor of Planetizen. He specializes in work at the intersection of technology and planning.
Acknowledgements
The authors would like to thank UCLA undergraduate Megyn Rugh, who served as a research assistant on the project; CalPoly, San Luis Obispo Planning Information Systems (CRP 457) students, who conducted preliminary data gathering; and Urban Insight staff Olga Serhijchuk and James Brasuell, who assisted with data validation and editing, respectively.
Appendix 1: Methodology
We developed a subjective list of 12 key indicators for city planning departments and then evaluated the websites of over 500 cities across the United States between May and July of 2014. This data was then aggregated to produce the findings of this benchmarking survey. For more information about our methodology, please evaluate the methodology appendix.
Cities were derived from the full list of designated places assessed in the U.S. Census Bureau’s 1-year American Community Survey results (N=561 based on 2012 ACS 1-year estimates). The total represented U.S. urban areas both large and small (greater than 65,000). It also offered the capability of reputable and repeatable sourcing method tied to existing demographic data in the communities evaluated.
Typically, the most current data is found in the 1-year estimates, although they lack the precision of five-year estimates, which was appropriate with our goals of benchmarking the up-to-date characteristics of web technology in planning organizations throughout the United States. After gathering this data we filtered out 33 places with a Census Subdivision designation, which usually includes unincorporated areas that are classified as distinct places (N=528). The respective sample achieved a statistically significant result at the 95th confidence interval with a margin of error of less than +/- 3 percent.
Data for each city was gathered by student researchers. Data was then refined and validated by the research team. The results were then checked for accuracy by an independent source. Following this we used descriptive statistics and crosstabs to make observations about trends in web use in planning firms throughout the United States. As indicated in the introduction this was done with a eye not only toward national trends but to evaluating technology use by city size and geography.
A histogram of the cities is provided in Figure 1. Given the distribution we classified cities into cohorts for analysis. Cities less than 100,000 are classified as small, those between 100,000 and 199,000 as medium, and those greater than 200,000 as large. This taxonomy is consistent with other work indicating that cities beyond 200,000 may have much different socio-economic dynamics than cities that are significantly smaller—a factor which could contribute to differences in technology adoption and use.
Appendix 2: Tools
To determine the web platform a website was running on we used Wappalyzer, which identifies different technologies being used by a website. It is available as an add-on for Firefox and Chrome web browsers.
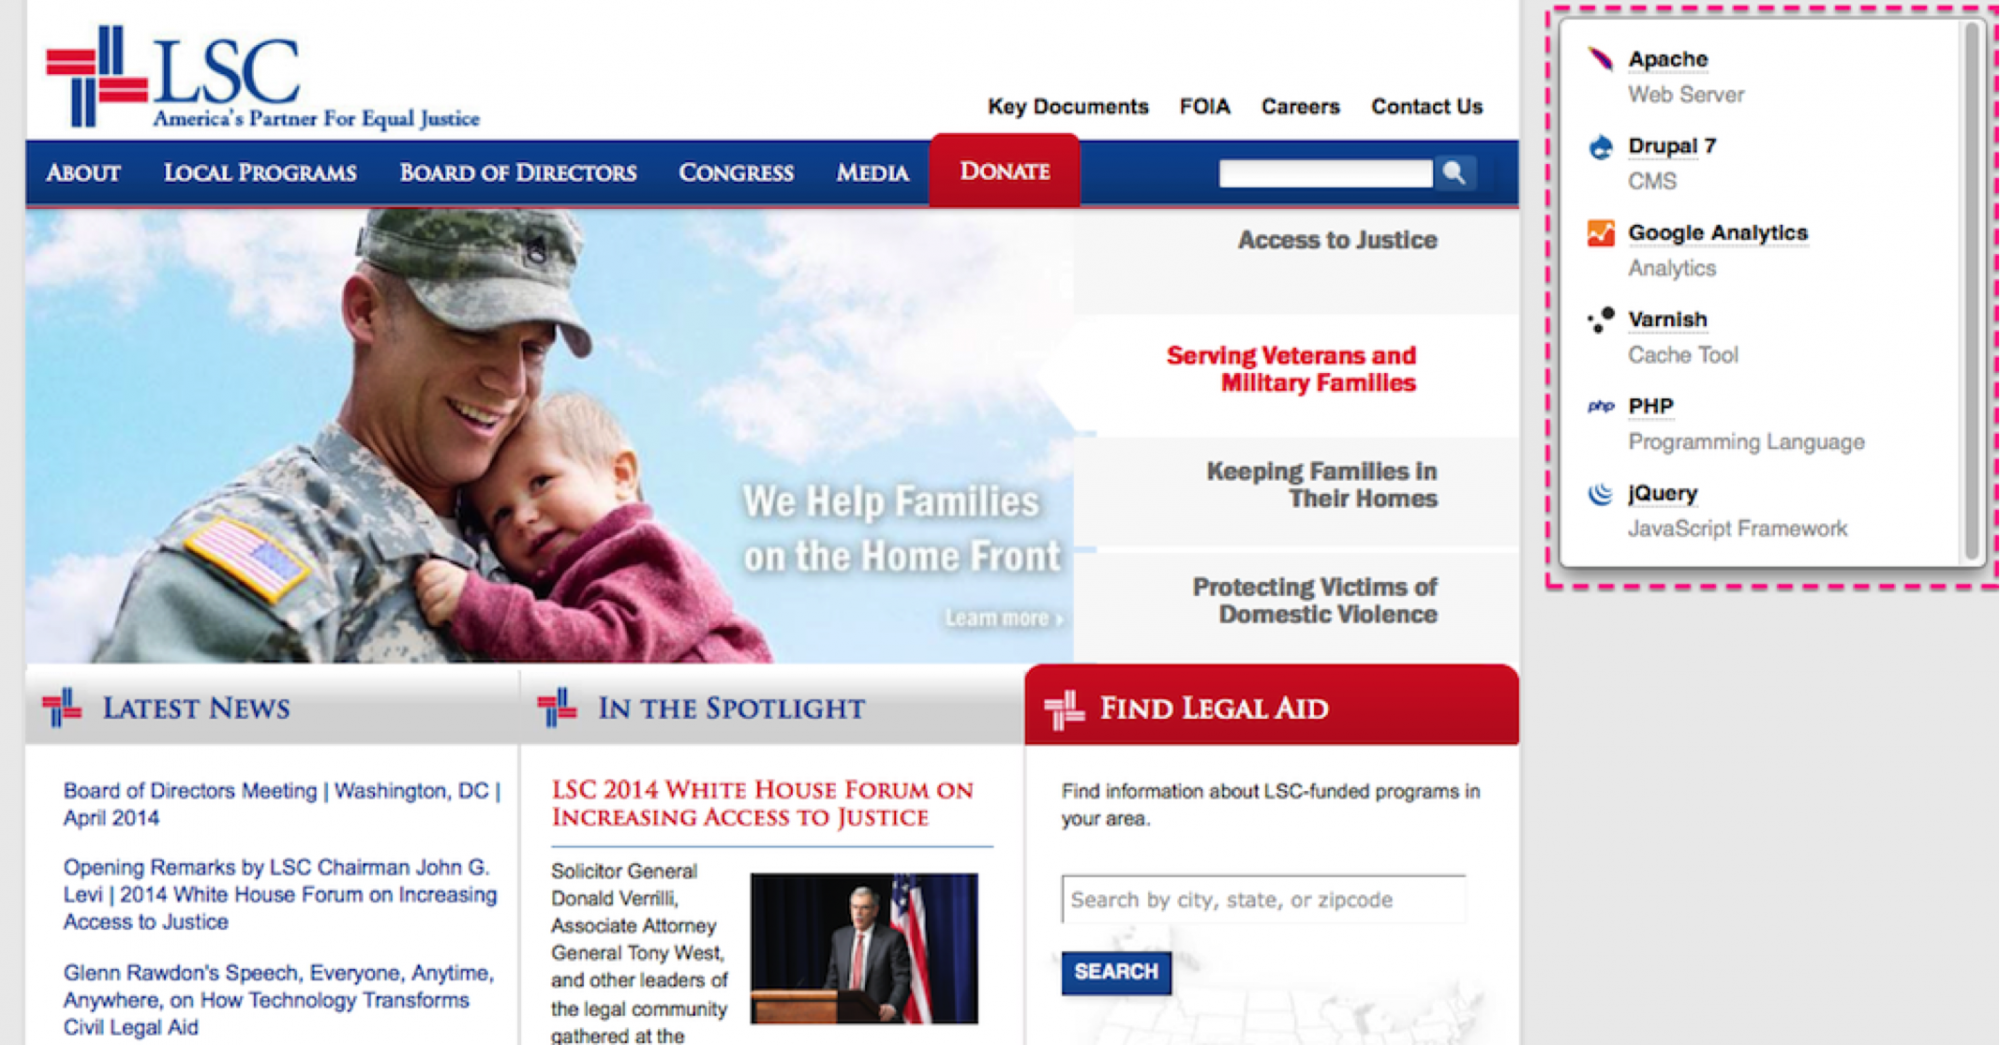
Here is a screenshot of Wappalyzer identifying web technologies used by the LSC website.
To determine percent of website's pages in PDF or DOC and to determine content readability levels, we used the Google's Advanced Search feature.
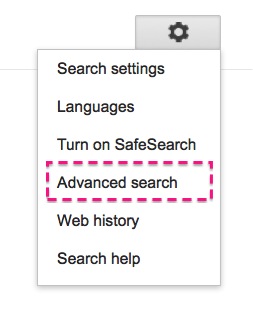
First determine the total number of pages on a website by specifying the website URL and hitting search. Google will report the total count of URLs visible. To determine filetype, specify site or domain and file type.
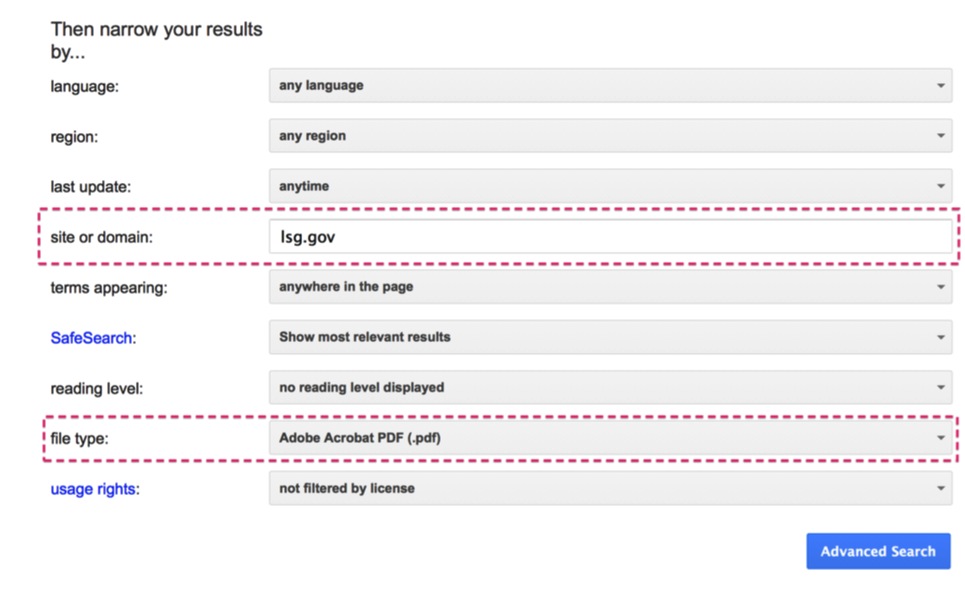
To determine reading level, specify site and select "annotate results with reading levels" for reading level.

City Planning Department Technology Benchmarking Survey 2017
A report on the current state of Internet technology used by 600 cities across the United States, including recommended steps cities should take to improve their technology assets in 2017-2018.
City Planning Technology, 2019 Benchmarking Study
A report on the current state of Internet technologies, policies, and content management systems adopted by 600 cities across the United States, including recommended steps cities should take to improve technology assets in 2019.

Virginia Coalition Calls for Increased Data Center Industry Oversight
Environmental groups voice concern that the states large, and growing, number of data centers is putting unsustainable pressure on natural resources and utility infrastructure.

Planetizen Federal Action Tracker
A weekly monitor of how Trump’s orders and actions are impacting planners and planning in America.

Map: Where Senate Republicans Want to Sell Your Public Lands
For public land advocates, the Senate Republicans’ proposal to sell millions of acres of public land in the West is “the biggest fight of their careers.”

Restaurant Patios Were a Pandemic Win — Why Were They so Hard to Keep?
Social distancing requirements and changes in travel patterns prompted cities to pilot new uses for street and sidewalk space. Then it got complicated.

Platform Pilsner: Vancouver Transit Agency Releases... a Beer?
TransLink will receive a portion of every sale of the four-pack.

Toronto Weighs Cheaper Transit, Parking Hikes for Major Events
Special event rates would take effect during large festivals, sports games and concerts to ‘discourage driving, manage congestion and free up space for transit.”

Berlin to Consider Car-Free Zone Larger Than Manhattan
The area bound by the 22-mile Ringbahn would still allow 12 uses of a private automobile per year per person, and several other exemptions.
Urban Design for Planners 1: Software Tools
This six-course series explores essential urban design concepts using open source software and equips planners with the tools they need to participate fully in the urban design process.
Planning for Universal Design
Learn the tools for implementing Universal Design in planning regulations.
Heyer Gruel & Associates PA
JM Goldson LLC
Custer County Colorado
City of Camden Redevelopment Agency
City of Astoria
Transportation Research & Education Center (TREC) at Portland State University
Camden Redevelopment Agency
City of Claremont
Municipality of Princeton (NJ)