


A report on the current state of Internet technologies, policies, and content management systems adopted by 600 cities across the United States, including recommended steps cities should take to improve technology assets in 2019.

Emerging technologies are fundamentally changing the planning, development, and management of cities, as cities around the globe grow more technologically advanced and connected. Throughout the day-to-day business of running cities, planning and development offer some of the most fundamental and visible forms of government action, impacting everyone who lives and works in cities.
The purpose of this benchmarking survey (the third in a series, with previous reports from 2015 and 2017) is to evaluate the state of technologies used by cities, the adoption of policies to govern technology-enabled practices (such as short-term rental housing, ride-hailing services, and autonomous vehicle services), and to determine how cities respond to the demands of citizens and businesses they serve.
The report focuses on the websites of city planning departments as one of the most common places citizens interact with government—on topics related to their homes, jobs, and travel habits. Citizens and businesses are increasingly accessing public documents via mobile phones and tablets and using new forms of geospatial and location-based data from planning websites. According to the Pew Research Center, six in ten U.S. adults get news and information via mobile phones, with younger populations and non-whites being even more likely to use mobile phones for those purposes. The goal of this study is to quantify how cities are meeting these new and emerging demands.
This report benchmarks the use of technology in city planning departments across the United States as of June 2018, identifies trends based on changes from our research in 2015, and 2017, and suggests best practices for using technology in planning and cities in 2019 and 2020.
Methodology
We evaluate local government websites using the same ten key indicators from previous technology benchmarking surveys conducted in 2015 and 2017, focusing on city planning departments as one of the most basic ways that local citizens interact with local government. We have also added five new metrics for 2019: Open data portals, short-term lodging (e.g., Airbnb/VRBO), transportation network company (TNC) policies (policies governing companies like Lyft and Uber, also known as ride-hailing companies), traffic routing policy (policies that define how TNC vehicles may travel through the city), and autonomous vehicle (AV) policies.
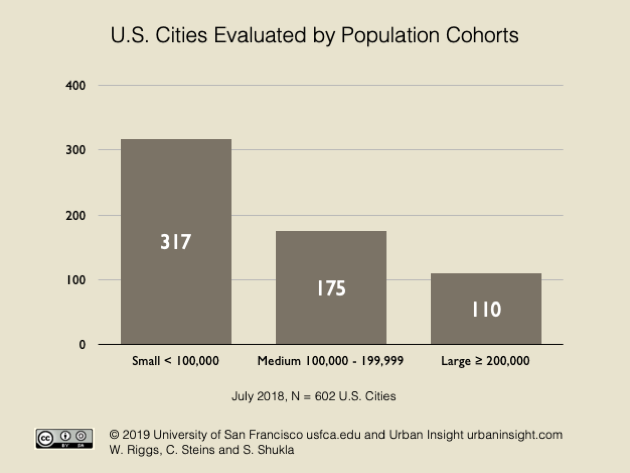
This evaluation focuses on 602 cities across the United States, gathering data between April and June 2018 and classifying the cities into cohorts for the purpose of analysis. We then aggregated the data to produce the findings of this report. The research team compared these findings from previous reports. The margin of error is +/- 4%.
Findings
100% of city planning departments have a website.
- Of the 602 cities we evaluated, all of them had a dedicated page, collection of pages, or website for their planning department. Only two cities (1%) did not have a website for their planning department in the 2017 evaluation, however these two cities now have websites.
- The Civic Plus (16%) and Vision (12%) content management systems now make up a large share of the market for city planning websites.
- Open source content management systems, WordPress (7%) and Drupal (6%), are the next two leading content management systems.
- There has been a 65% increase in city planning departments using a web content management system between 2017 (37%) and 2019 (61%).
- More cities now cities now use a content management system than a custom web framework. In 2015, 47% of cities used a custom framework.
- Most cities (95%) have moved away from static websites.
61% of city planning departments use a web content management system.
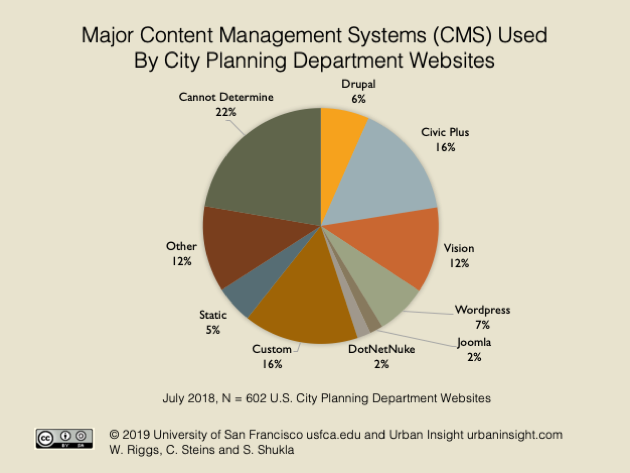
Modern web publishing uses content management systems to facilitate the process of publishing content. To publish on the web in the past, the author required some programming abilities. The trend over the last decade is to build websites using a content management system (CMS). By using a content management system, authors can add, edit, and delete content, images, or videos on a website using a web interface. While use of most major content management systems we identified has increased since 2017, the rapid emergence of proprietary content management systems, such as Civic Plus and Vision, by the cities in our sample suggest that some content management systems are evolving to focus specifically on the needs of cities.
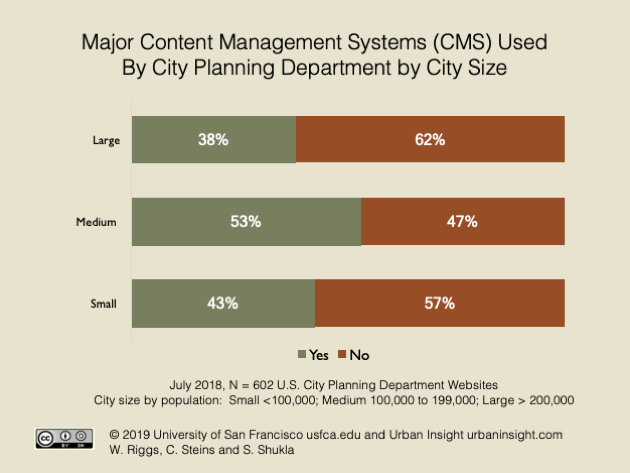
Medium-sized cities are leading the adoption of content management systems. We have also found an inverse relationship between city size and CMS. Smaller and medium-sized cities are more likely to adopt Civic Plus, Vision, and Wordpress as their CMS, while larger cities are more likely to use Drupal, Adobe Experience Manager, Ektron, Sitecore, and SiteFinity, which tend to be more complex to implement.
We identified content management platforms used by planning department websites using the Built With tool (see Appendix 2, Tools).
Responsive design increased by 20%.
- 78% of city planning department websites now use responsive design, a best practice that tailors the site appearance to the size of the user's screen.
- The percentage of responsive websites increased by 20%, up from 58% in 2017 and 15% in 2015.
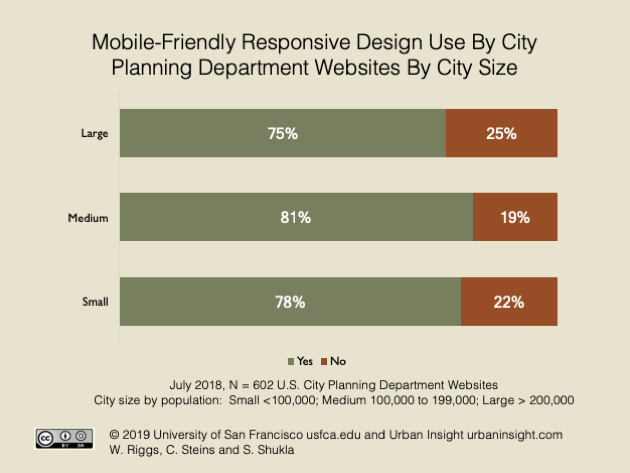
- Smaller and medium-sized cities have caught up with, and even outperform, larger cities in adopting responsive design.
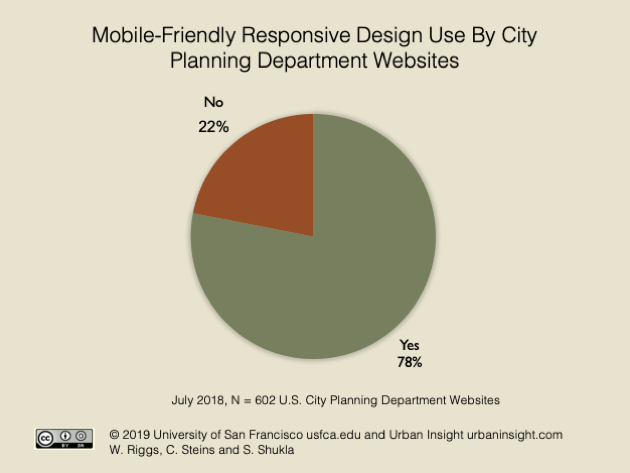
Traffic from mobile devices such as smartphones and tablets continues to grow. The use of mobile devices to access the Internet surpassed the use of desktop devices in recent years. The Pew Research Center now estimates that 95% of Americans own some kind of cell phone and 77% own a smartphone. Research indicates that this access spans broad demographic and socio-economic lines, with one in five adults being “smart-phone only” Internet users, meaning they own a smartphone, but do not have traditional home Internet service.
Responsive web design is the gold standard for building a website. Responsive design allows for websites to adapt to the screen size of the user. Responsive design has emerged as the preferred approach for building a single website that is accessible on multiple devices, from desktop computers to smartphones.
In a departure from 2017 results, but similar to 2015 results, cities that were smaller (and medium) have proportionally more responsive websites than large cities with a population over 200,000.
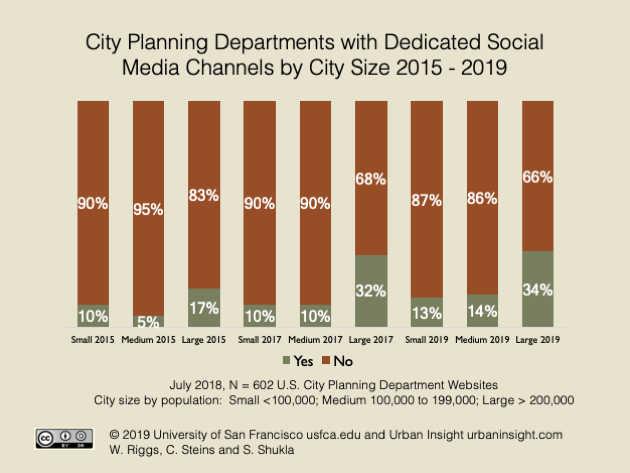
17% of city planning departments have dedicated social media channels.
- The use of social media is up 3% from 2015.
- Facebook remains most popular (16%), followed by Twitter (3%) and LinkedIn (2%).
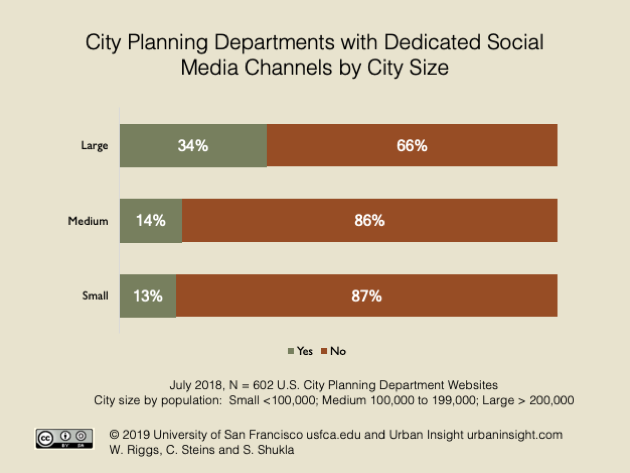
- Social media use is highest in large cities, where use has almost doubled in the past two years—from 17% to 32%.
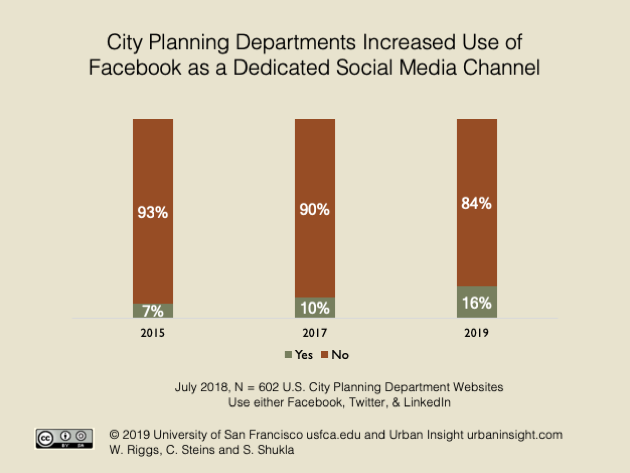
- Facebook use by city planning departments went up by 6% from 2017 (when it was used by 10% of cities), while Twitter and LinkedIn stayed the same or declined during the same period.
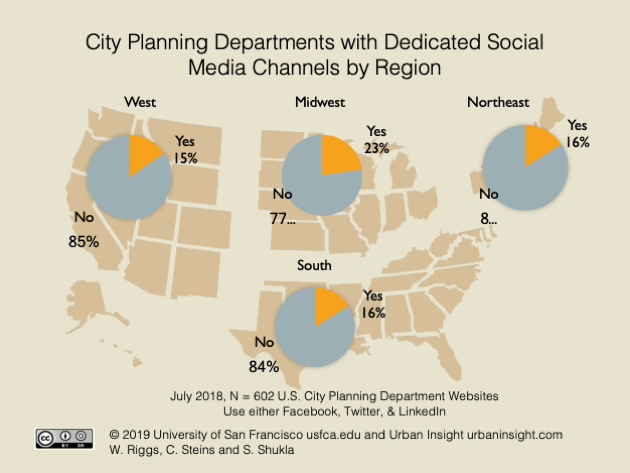
- Also, as with past surveys, social media use by planning departments is slightly higher in the Northeast, South, and Midwest than in the West. It is particularly high in the Midwest.
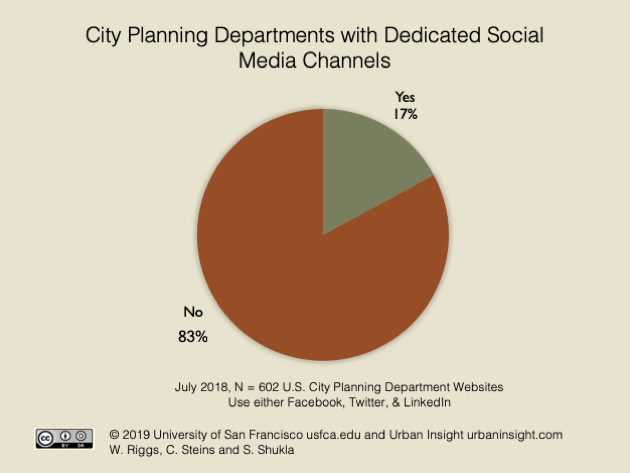
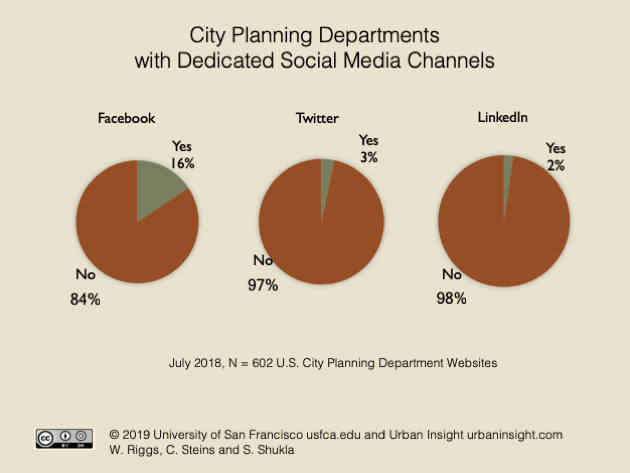
Social media sites such as Facebook, Twitter, and LinkedIn have gained popularity as additional tools for communicating with stakeholders. We evaluated city planning departments to determine if they had set up a Facebook page, Twitter account, or LinkedIn group dedicated to the department.
We speculate that the increased use of social media among larger cities also relates to how social media tools suit the needs of complex urban organizations comprised of many divisions with varying needs. Also, the higher staffing levels of larger planning departments may be necessary to support social media efforts.
Facebook remains the leading social media platform used by city planning departments to communicate with constituents, with LinkedIn and Twitter showing small gains during the two years since our last assessment. We had hypothesized that LinkedIn particularly would see increased use due to the acquisition by Microsoft (which has an exceptionally strong presence in local government). However, this increase has not materialized.
92% of cities post the majority of their online content in HTML format.
- 8% of city planning departments have the majority of their content in PDF or DOC/Word format, which makes the content less usable.
- This is an increase of approximately 5% since 2017 but it is lower that 12% of websites that had the majority of their content as PDF or DOC/Word formats in 2015.
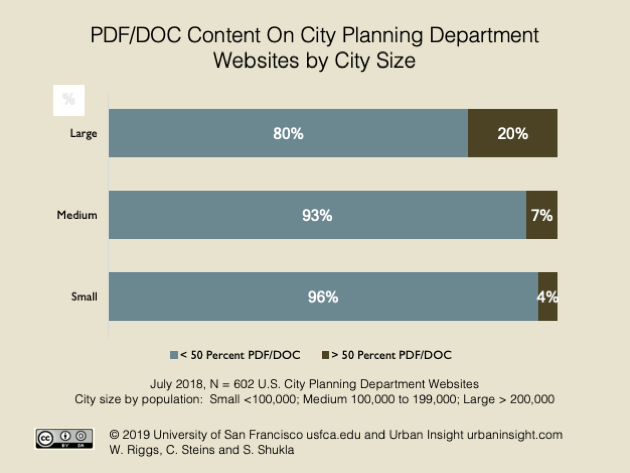
- Large cities are more likely to publish a majority of content using PDF and DOC/Word files on their websites.
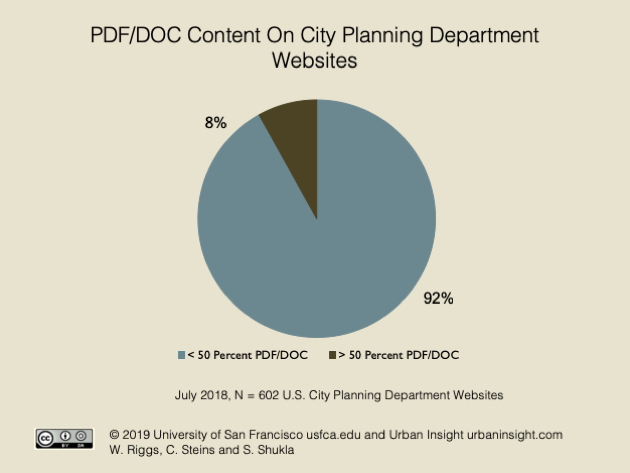
HTML content makes up much of the content that appears on the Internet, but there are other ways to deliver information on the web. These include portable document format (PDF), Microsoft Word (DOC) or shared docs (for example Google Drive). These non-HTML formats have their place but are often difficult or inconvenient to read on mobile devices and difficult to search, generally decreasing the usability of web content.
We used Google Advanced Search (See Appendix 2, Tools) to find the number of pages that city planning department websites posted in HTML, PDF or DOC/Word format, and then classified those that had below and above 50% of web content in either HTML or PDF/DOC formats. Of this, 8% of cities posted more than 50% of their content in PDF or DOC/Word format. Large cities are on the whole far more likely to have the bulk of their content in PDF and Word formats.
88% of city planning departments offer their zoning code online, 3% more than in 2015
- 55% offer the zoning code in an HTML format, a best practice.
- 33% of planning departments offer the zoning code as a PDF, which makes it less usable.
- Departments offering zoning code in HTML increased 9% since 2017 and 11% since 2015.
- Departments offering zoning code in PDF decreased 5% from 2017.
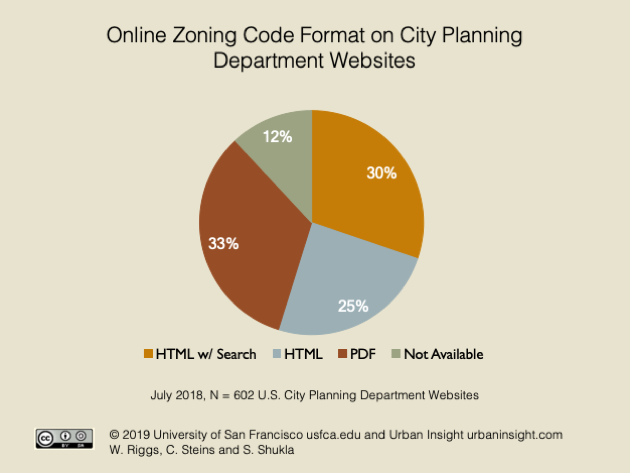
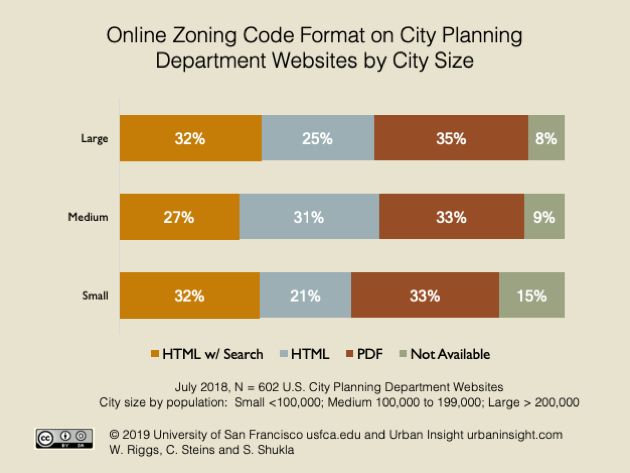
Zoning is one of the most basic forms of governing and regulation, and zoning is central to the role of planning and community development departments. We evaluated whether cities maintain zoning code online, and the format cities use to present zoning codes online.
The gold standard for online zoning code usability is presented in HTML format, is mobile responsive, and is fully searchable. Zoning codes in portable document format (PDF) are generally less desirable, especially PDFs that have been scanned from printed documents, which typically renders the content of the zoning code unsearchable.
We found that 85% of planning departments publish their zoning code online. This is a slight increase from 85% in 2017 and 83% in 2015. There was a 5% decrease in the number cities using PDFs, from 38% to 33%.
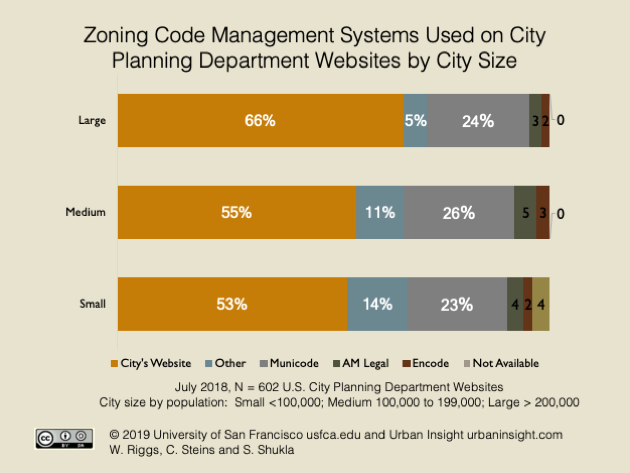
56% of cities self-published their zoning code.
- Among those that use a zoning code publishing system, Municode is the most common, used by 24% of cities.
- Self-publishing is up 8%, particularly in large cities, where 66% of cities publish their zoning code on their own website.
- 56% of cities self-published their zoning code, up 8% from 2017 and 25% from 2015.
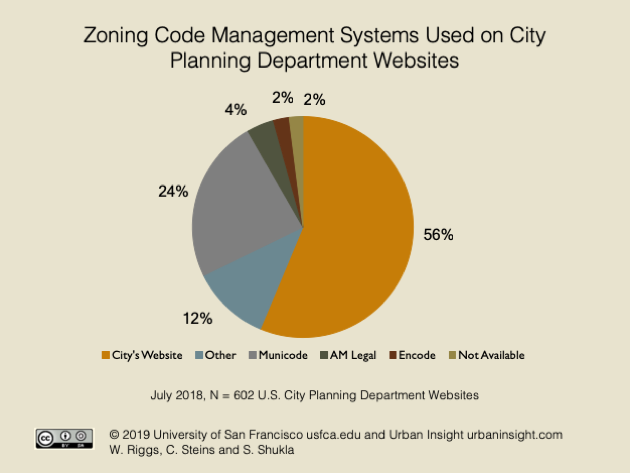
Zoning codes are complex, and zoning codes are also updated, referenced, and interpreted on a regular basis. That complexity and the constant attention required requires many cities to outsource zoning code management to companies that provide management and publishing of municipal codes or to publish the latest version of the document as a PDF. At the same time, emerging trends and software technologies are helping cities to better manage zoning. This includes recent open-source zoning code systems piloted by the city of Los Angeles, CA , and efforts by the OpenGov Foundation, which has established an open format for publishing government documents, including zoning codes. [Disclosure: Planetizen is affiliated with Urban Insight, Inc., which worked with the city of Los Angeles to develop the open-source zoning code system.] Additionally, several new entrants, such as Encode, are emerging in the zoning code management system space. While this makes up only a small percentage of the market, it is an emerging trend to watch.
10% of city planning departments do not offer their general plan online.
- 90% of planning departments have their general planning documents online in some format, up 12% since 2017.
- 26% of planning departments publish the general plan in HTML, a best practice.
- 64% of planning departments publish the general plan using in PDF, which is less usable.
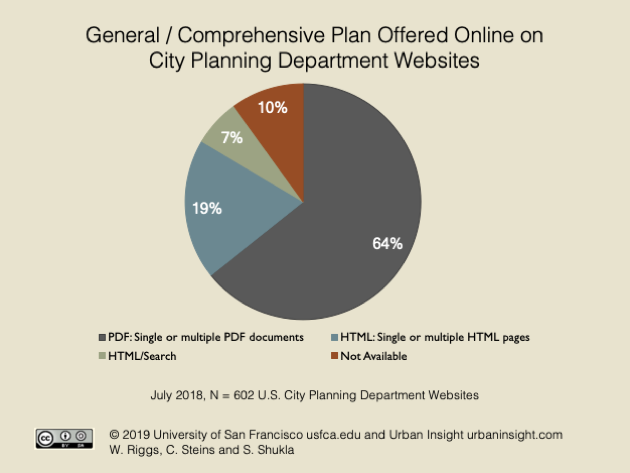
A general plan (also known as a comprehensive plan) is the guiding document that defines future land uses in most cities. We evaluated whether planning department websites publish general plans online, as well as the format of the published general plan. As with zoning codes, the gold standard for general plan usability is presented in HTML format, is mobile responsive, and is fully searchable using words or phrases. General plans in portable document format (PDF) are generally less desirable.
While we saw very little change between 2015 and 2017, where 22% of websites did not publish their general plan online, that number fell to 10% in 2019. The number of cities publishing these documents in HTML format also increased to 26%, up from 11% in 2017. Cities achieved the increase of HTML formatted documents despite the difficulties in converting complex, highly designed printed documents to an equally attractive online format.
We previously predicted an increase in publishing general plans in HTML forms over the next five years. Thus far, that prediction has been accurate.
36% of city planning departments update their website at least monthly.
- Visible updates to city planning department websites in the last 30 days decreased 17% since 2017.
- 43% of city planning departments had no visible updates in the previous six months.
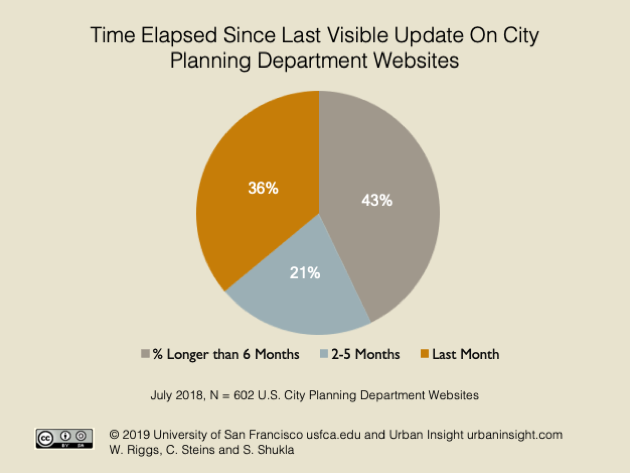
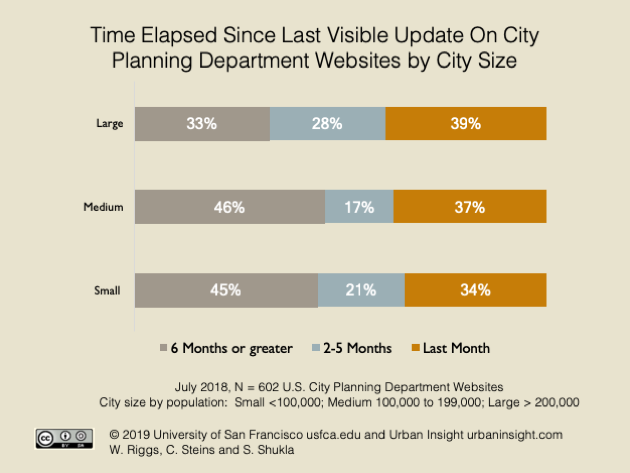
Updating content on a regular basis can be a way that websites stay fresh and relevant to customers. For planning departments, publishing regular updates provides a window to the workings of government and signals the department's interest in engaging with the public. We evaluated city planning department websites to discover the last visible website update performed by the department.
We found that fewer websites were updated regularly than in our last survey. During the period of evaluation, 36% of websites showed a visible indication of content changes within the last 30 days, down from 53% during our survey in 2017. In contrast, 43% of sites did not appear to have been updated in the last six months, up from 26% in 2017.
While this finding may be random and may not indicate a trend, because the finding varies so drastically from findings of previous surveys (when over 50% of cities regularly updated their websites), these finds are worth considering in the future. We hypothesize that cities will encounter an increasing need to hire data and content managers as the depth and breadth of digital information increases. It is possible that cities might be falling behind in recruiting and retaining tech-savvy personnel to manage growth in planning and transportation-related web and data programs.
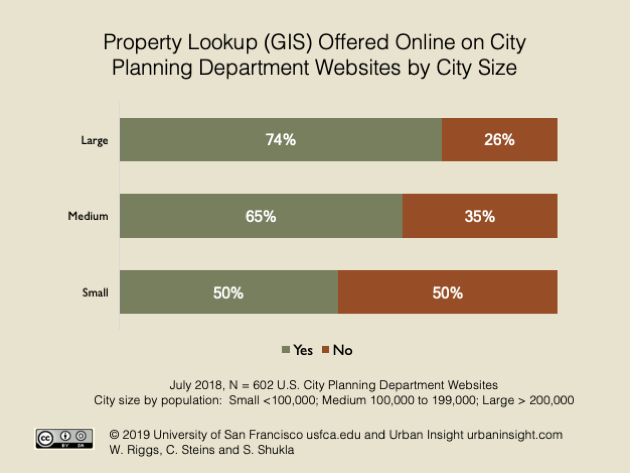
58% of cities offer an online GIS tool to search properties.
- The use of online GIS increased 11% since 2017.
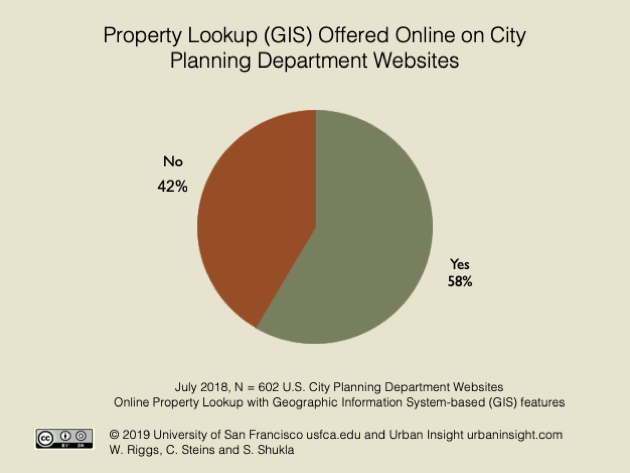
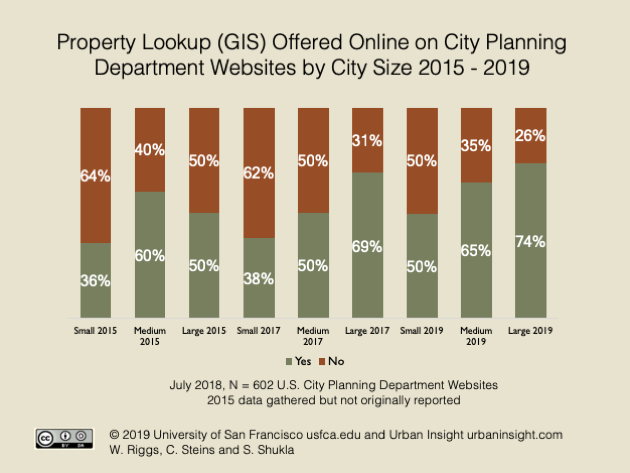
The ability to search information about a specific property using a web-based system is often provided by the city, county, or other agency, and many times is indicative of investment in a web-based geographic information system (GIS) or mapping system. We evaluated whether the planning department had, in some form, an online tool to search properties on its website.
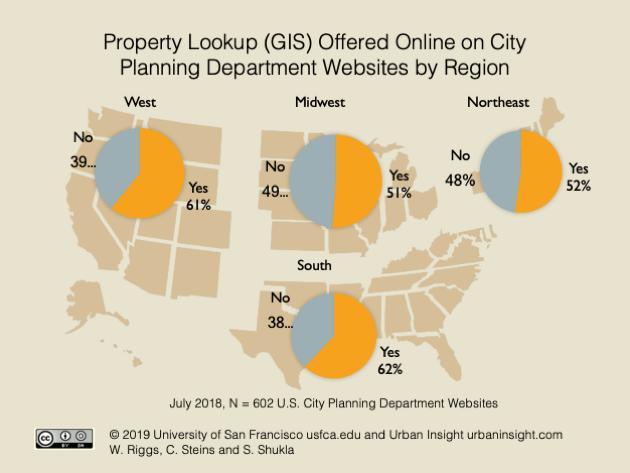
As predicted in past surveys, adoption of online GIS has increased, from 40% in 2015 to 58% in 2019. Approximately 74% of large cities offer GIS tools to search properties. While Esri still dominates the market for online GIS, we saw increased use of new systems, such as Buildingeye, idevelop.city, OppSites, Penciler, Zonar and others, offering varying degrees of property search services. As with our 2015 and 2017 results, GIS property search capabilities are slightly more common in the West and South than in the Northeast and Midwest. Growth has been most strong in Small and Large cities.
47% of the cities surveyed offer online permitting.
- Online permitting increased 12% from 2017.
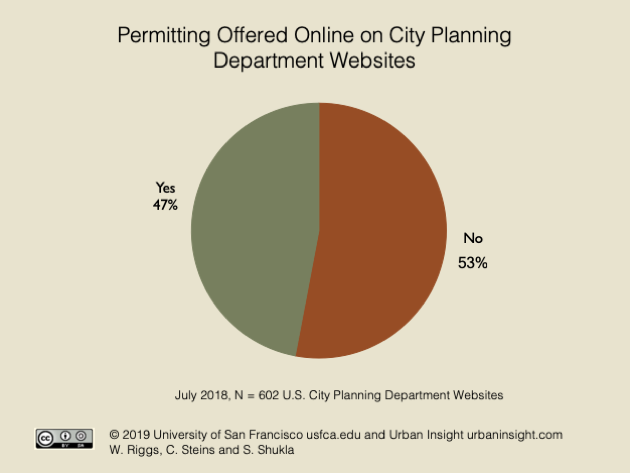
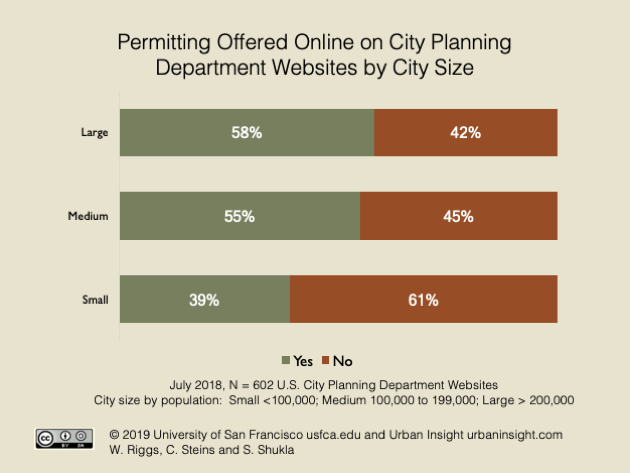
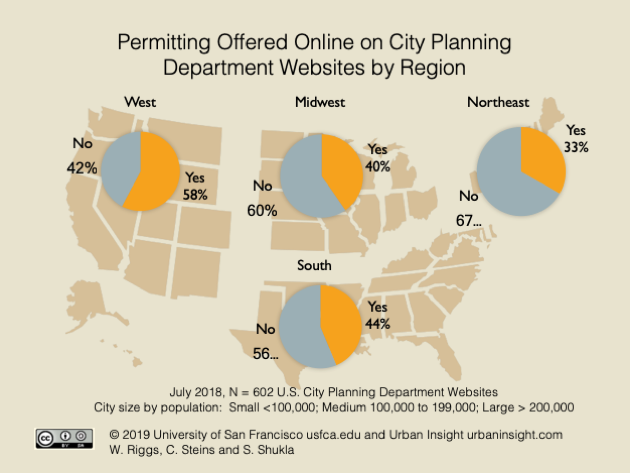
The authority of the planning or building department to issue permits for building or modifying structures is an important power that cities have in shaping the type of develop that can take place. Traditionally, a manual, time-intensive process requires citizens and businesses to visit the planning department to request, comply with, or pay for a permit. Emerging technologies and a broader reliance on e-commerce as an acceptable and desired alternative to face-to-face transactions are changing how planning departments perform permitting transactions.
We evaluated whether online permitting was available on the websites of the planning departments under study. While the majority of cities (53%) do not support online permitting, there was a continued increase in the number of cities offering such services. Over 50% of both large and medium cities now offer some form of online permitting services. We anticipate continued growth in this area as cities adapt to user demands for more online services and more standardized, less discretionary permitting processes.
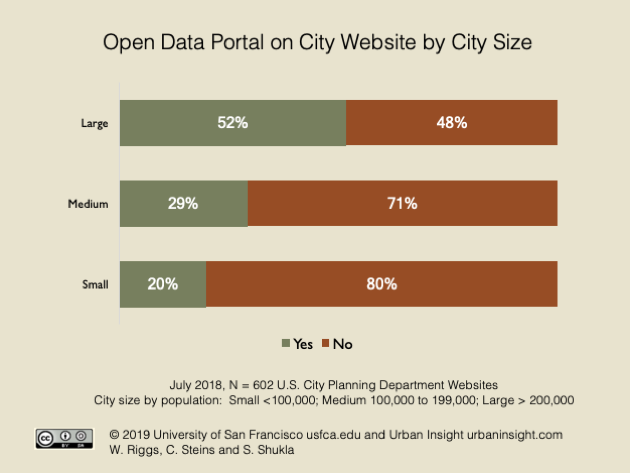
28% of the cities surveyed have open data portals
- Larger cities lead the adoption (52%) of open data portals.
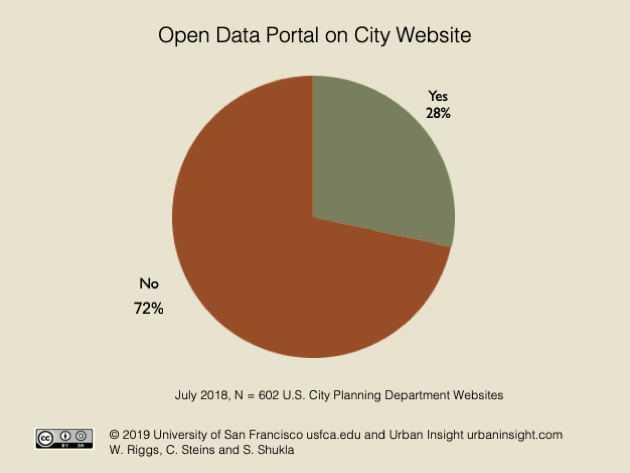
Open data in government is the idea that government data should be available to the public, for free, without restriction, and in an electronic format that can be viewed and analyzed by the public. Open data might include a list of building permits issued, building violations issued, or service requests received. The potential benefits of open data include increased transparency, higher levels of participation, improved or new products and services, new measurements of the impact of policy, and increased efficiency.
Companies such as Socrata and OpenGov offer software tools to make publishing and analyzing open data easier, as well as open source products such as can, which is used by the United States open data portal, data.gov.
This is the first time we surveyed the existence of open data portals. We did not attempt to identify the software used to support these systems or to quantity them for this survey. We might do so in future surveys, however.
Examples of open data portals:
- Los Angeles Open Data
- Data SF
- NYC OpenData
- Chicago Data Portal
- Indiana Data Hub
- Analyze Boston
- City of Houston Open Data Portal
- Louisville Metro Open Data
Cities are adapting to other data issues and disruptive technology from the private market, particularly in transportation and housing.
- 19% of cities have adopted an ordinance related to short-term lodging policy (e.g., Airbnb, VRBO).
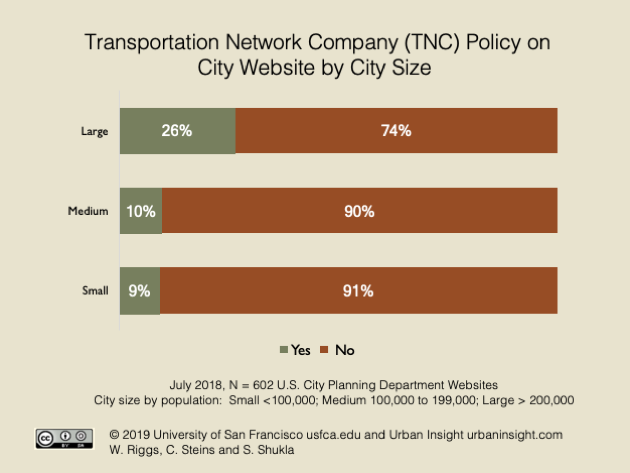
- 24% of cities have adopted policies for transportation network companies (TNCs) (e.g., Lyft, Uber) or policies that regulate how TNC vehicles traverse the city.
- 12% of U.S. cities have an autonomous vehicle policy. Another 5% have an autonomous vehicle ordinance or general plan.
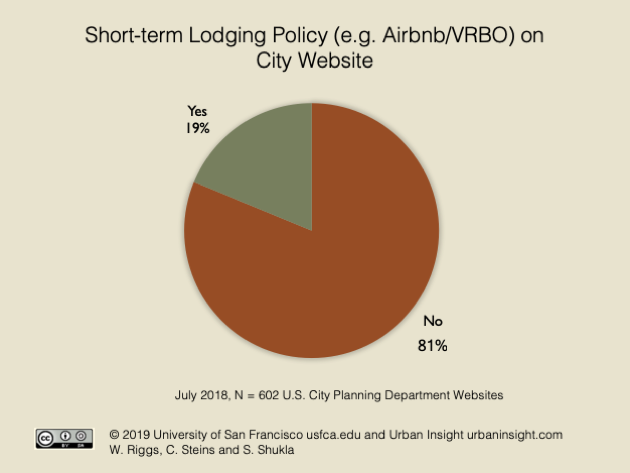
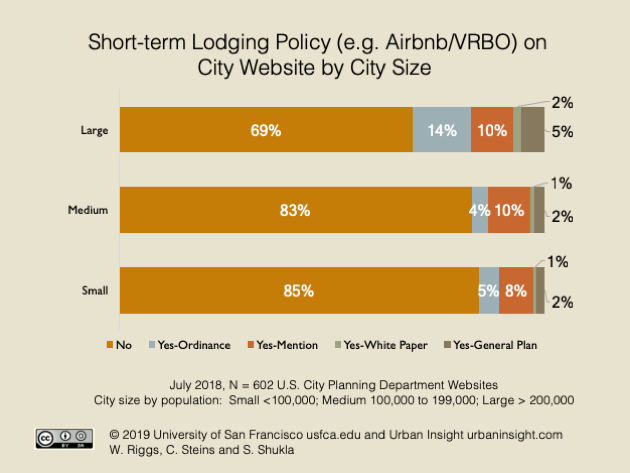
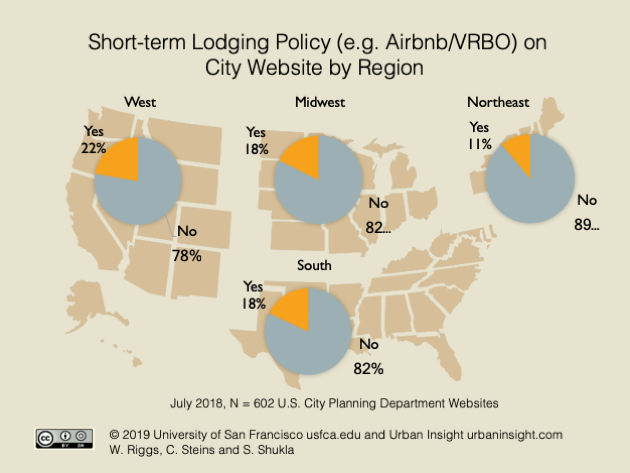
Short-term rentals are becoming an increasingly popular lodging choice for travelers in the United States. Advances in technologies and the emergence of services like Airbnb and VRBO have created accessible and popular marketplaces for owners and renters to interact, simultaneously reducing the transaction costs of short-term rentals. However, commercialized short-term rentals can negatively impact communities by inflating rentals costs, reducing the availability of longer-term housing, reducing local tourism tax revenue, and impacting the social fabric of neighborhoods.
Some cities are re-evaluating their regulatory frameworks in an attempt to regulate these leasing activities, accommodate the short-term rental business while safeguarding hosts, renters, residents, and neighborhoods.
This is the first year we have surveyed the existence of short-term rental policies. Examples of short term rental policies include:
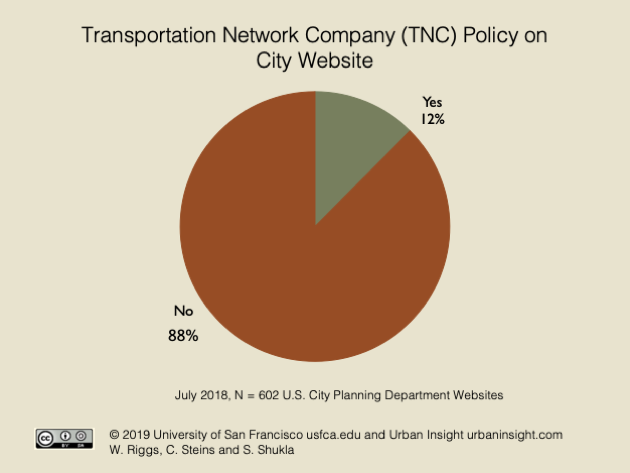
Transportation network companies (TNCs), sometimes called ride-hailing services, are organizations that connect passengers with drivers through the use of technology, such as websites and mobile apps. Uber and Lyft are probably the most visible examples of TNCs.
TNCs provide door-to-door service, eliminate the chore of parking, and offer a variety of vehicle choices. The TNC model may allow drivers to avoid the costs of insurance, sales tax, inspections and universal service. However, research suggests that TNCs might also increase traffic congestion, add to vehicles miles traveled, steal riders from public transit, and increase traffic fatalities.
In many locations the authority to regulate TNCs is held at the state level, but some cities are evaluating operating conditions for TNCs within the city and establishing policies, routes, and conditions for the operation of TNC vehicles in the city.
This is the first year we have begun surveying for the existence of TNC and transit routing policies. Example policies include:
- Austin, Texas
- Chicago, Illinois
- Portland, Oregon
- San Francisco, California
- San Jose, California
- Washington, D.C.
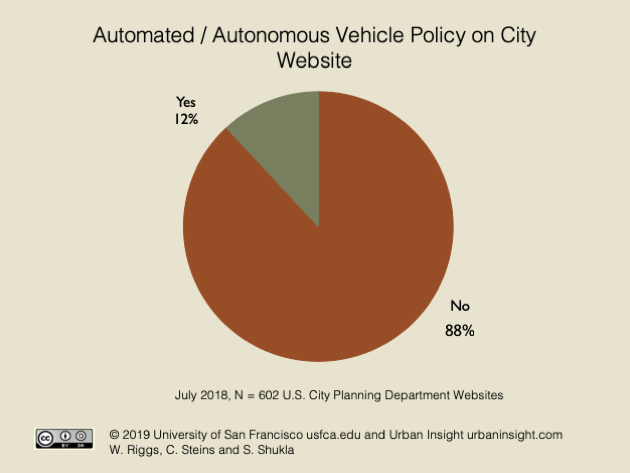
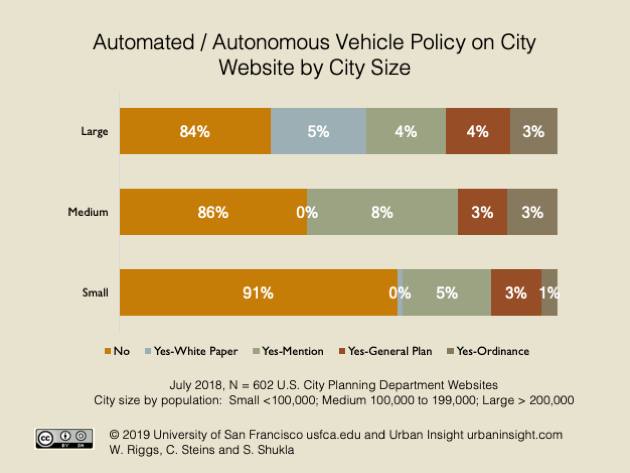
Autonomous and automated vehicles (AVs) have dramatic potential not only to reshape transportation but the built environment of cities. While uncertainty remains about the technology itself and how individuals will respond to it, academics have suggested that policy action can support and adapt more quickly to disruptive innovations. There has been very little policy action to start the process of evolving the built environment to meet the demands of new mobility while upholding societal values like sustainability and social justice.
While (similar to TNC policy) some states have preempted local policy on AVs, we found that 12% of U.S. cities have AV policies, and 5% have an AV ordinance or general plan. Of these policies, the key themes were in management (of transit, systems, parking, curb, data, etc.) and design (primarily streets and electric vehicle infrastructure). No cities focused on travel behavior or efforts to speed the policy process. These offer an opportunity for planners, policy makers, and innovators in the coming years.
This is the first year we have begun surveying for the existence of AV policies. Examples of AV policies:
- Austin, Texas
- Boston, Massachusetts
- Chico, California
- Menifee City, California
- Port St. Lucie city, Florida
- Portland, Oregon
- San Antonio, Texas
Conclusions
Based on our evaluation of time series data collected in June 2018, June 2016, and June 2014, our familiarity with the use of technology to support city planning departments, and the continuing emergence of new and potentially disruptive technologies, we make the following recommendations about the use of technologies in cities in 2019 and 2020.
The majority of adults now own and regularly use a mobile device to access the Internet. Responsive design allows for websites to adapt to screen size, making content accessible on mobile devices. If a city planning department is one of the 22% not using responsive design, the department should begin upgrading its website.
The market for content management systems (CMS) dedicated to the needs of planning departments and cities is maturing, with several companies now offering content management systems. 61% of planning departments are now using content management systems, up 20% from 2017. If a city is not already using a CMS, and is planning to update its website, the city should strongly consider the use of a content management system.
The percentage of traffic from smartphones and tablets will continue to grow, and cities will increasingly experience pressure to convert information from PDF documents to HTML format, which is much easier to read on such devices. If updating a zoning code or general plan, cities should budget and plan for the use of an appropriate publishing platform to begin the process.
Citizens and businesses are increasingly accustomed to self-serve systems that allow complete transactions online. Planning departments that ease the transactional process of applying for non-discretionary permits by offering a sensible online process are likely to be rewarded with greater compliance and increased revenues. Leading software companies offer online GIS and online permitting and permit tracking systems that are increasingly affordable. Consider standardizing as many permitting transactions as possible, offering self-service and online processes to increase adoption and revenue.
The authors predict increased use of open government data, led by larger cities, to increased transparency, efficiency, and innovation. In our first year tracking open data government portals, we found 28% of cities surveyed have open data portals, and we expect this trend to accelerate in 2019-2020. We also see an increase in demand for data scientists both in planning departments and in local cities to evaluate and innovate based on the open data published. If cities do not yet have an open data strategy, they should evaluate the benefits and consider a pilot project in its 2019 and 2020 budget.
19% of cities have adopted an ordinance related to short-term lodging policy (e.g., Airbnb, VRBO). If your city is seeing growth in the number of short-term lodging units available, consider adopting a formal short-term lodging policy.
12% of cities have adopted policies for transportation network companies (TNCs) (e.g., Lyft, Uber) or policies that regulate how TNC vehicles travel through the city. In cities served by TNCs, policy makers should consider adopting a TNC policy or a policy to manage curbside access needed for TNC operations.
Likewise, 12% of cities have documents planning for autonomous vehicles and their impact on local roadways and networks. It is important that cities begin to think about these technologies and to integrate them into planning documents.
Finally, in the experience of the authors, the government departments (e.g., planning, building, transportation, legal, etc.) who have consistent success with technology initiatives have identified a technology-savvy team member to champion new approaches to technology by engaging with peers in the emerging field of civic technology.To advance new technology initiatives, consider identifying a technology champion within each department.
Acknowledgements
Thanks to research assistants, including Matthew Kawashima, Therese Perez, and Louis Yudowitz, who assisted with data validation, scrubbing, and analysis. Thanks also to students from University of San Francisco’s BUS 204 Quantitative Business Analysis and PADM 780 Program Evaluation and Monitoring courses, who helped gather data for this project.
About the Authors
Dr. William (Billy) Riggs, Ph.D., AICP, LEED AP a professor at the University of San Francisco School of Management, and a global thought leader in the areas of future mobility and smart transportation, housing, economics and urban development. He is the author of the book Disruptive Transport: Driverless Cars, Transport Innovation and the Sustainable City of Tomorrow. He can be found on Twitter at @billyriggs.
Chris Steins is Chief Executive Officer of Urban Insight, a technology consulting firm based in Los Angeles, California, and a founding editor of Planetizen. He specializes in work at the intersection of technology and planning. He can be found on Twitter at @urbaninsight.
Shivani G. Shukla, Ph.D., is a professor at University of San Francisco School of Management. She specializes in the fields of Operations Research, Statistics, and Game Theory. Her research is in security investment issues in the realm of supply chains and logistical networks. She has a B.S. and M.S. in Statistics from India, and a PhD in Management Science from University of Massachusetts Amherst.
Appendix 1: Methodology
Fifteen key indicators were chosen and then used to evaluate over 600 city planning departments across the United States. This methodology for benchmarking websites was based on comparable evaluation conducted for the legal and planning industry and validated through peer-review (Cabral, Chavan, Clarke, & Greacen, 2012; Chavan, 2014; Riggs, 2016).
These metrics include factors that can facilitate better and timely information to citizens and businesses, as well as the ability to tailor websites to user needs, and the ability of cities to respond to new and potentially disruptive technologies. The tools used to evaluate these metrics are included in Appendix 2.
Our cities data is taken from U.S. Census Bureau's 1-year American Community Survey results using the 2012 ACS 1-year estimates as a benchmark for comparison. Using the 1-year figures was appropriate because the goal was to benchmark the up-to-date characteristics of web technology in planning organizations throughout the United States. Typically, the most current data is found in the 1-year estimates, although this data lacks the precision of 5-year estimates. The 1-year ACS data also offered the capability of reputable and repeatable sourcing method tied to existing demographic data in the communities evaluated.
Since 1-year estimates do not represent urban areas from smaller than 65,000, we also add a sample of 100 of the ~2,000 small cities found in the 3-year estimates. This yielded a total of 659 cities. After gathering this data, unincorporated areas, or those with a Census Subdivision designation (N=57), were filtered out. This provided for statistically significant results at the 95th confidence interval, with a margin of error of less than +/- 3.9%. The data collected was then validated for accuracy by a secondary evaluator, and aggregated to produce the findings of this benchmarking survey.
Summary of Changes from 2017 to 2019
This survey builds on surveys released in 2015 and 2017 which evaluated the state of urban planning websites at that point. While most of the variables collected are the same, a few changed and some of the collection methods changed based on changing technology. While we continue to test mobile responsiveness, using Google for responsive design, due to reliability issues we have not continued assessing page speed and user experience using Google’s Pagespeed Insights. We also shift to using ‘Followers’ as opposed to ‘Likes’ for our social media assessment since it better matches the way companies like Facebook use their product.
Our most significant changes involved the inclusion of data points evaluating how city policy and websites are responding to new emerging and disruptive technology, particularly in the areas of transportation and housing technology. We have added five new metrics for 2019: Open data portals, short-term lodging (e.g., Airbnb/VRBO), Traffic Network Company policies (Policies governing transportation network companies like Lyft and Uber), Traffic Routing Policy (policies that define how TNC vehicles may travel through the city), and autonomous vehicle (AV) policies.
For the cities we evaluated, our longitudinal unit of analysis (the top ~500 cities in the US based on 2012 Census ACS 1-year data) remained the same, although we continue to add a random sample of cities below the 60,000 person ACS threshold, using Census 2012 3-year estimates. There were a total of 2,143 municipalities with estimates in the 2012 3-year data.
Appendix 2: Tools
|
Indicator |
Method of Evaluation |
|
Website Existence |
Visual survey |
|
Content Management System (CMS) |
|
|
Responsiveness |
|
|
Social Media (Facebook, Twitter and LinkedIn) |
Visual survey |
|
Percent of Content in PDF and DOC Format |
|
|
Online Zoning Code |
Visual survey |
|
Zoning Code Publishing System |
Visual survey |
|
General Plan Availability |
Visual survey |
|
Last Visible Update |
Visual survey |
|
Online GIS Property Search |
Visual survey |
|
Open Data Portal |
Visual survey |
|
Short term vacation rental |
Visual survey, Google Search, city website search (when available) |
|
TNC policy |
Visual survey, Google Search, city website search (when available) |
|
AV policy |
Visual survey, Google Search, city website search (when available) |


City Planning Department Technology Benchmarking Survey 2017
A report on the current state of Internet technology used by 600 cities across the United States, including recommended steps cities should take to improve their technology assets in 2017-2018.

City Planning Department Technology Benchmarking Survey 2015
The following report surveys the current state of Internet technology as employed by the planning departments of over 500 cities in the United States.

The 'Worst-Connected Cities' in the United States
Here are the cities where residents are the least likely to have a broadband Internet connection in their home.

Planetizen Federal Action Tracker
A weekly monitor of how Trump’s orders and actions are impacting planners and planning in America.

Chicago’s Ghost Rails
Just beneath the surface of the modern city lie the remnants of its expansive early 20th-century streetcar system.

Amtrak Cutting Jobs, Funding to High-Speed Rail
The agency plans to cut 10 percent of its workforce and has confirmed it will not fund new high-speed rail projects.

Ohio Forces Data Centers to Prepay for Power
Utilities are calling on states to hold data center operators responsible for new energy demands to prevent leaving consumers on the hook for their bills.

MARTA CEO Steps Down Amid Citizenship Concerns
MARTA’s board announced Thursday that its chief, who is from Canada, is resigning due to questions about his immigration status.

Silicon Valley ‘Bike Superhighway’ Awarded $14M State Grant
A Caltrans grant brings the 10-mile Central Bikeway project connecting Santa Clara and East San Jose closer to fruition.
Urban Design for Planners 1: Software Tools
This six-course series explores essential urban design concepts using open source software and equips planners with the tools they need to participate fully in the urban design process.
Planning for Universal Design
Learn the tools for implementing Universal Design in planning regulations.
Caltrans
City of Fort Worth
Mpact (founded as Rail~Volution)
City of Camden Redevelopment Agency
City of Astoria
City of Portland
City of Laramie