


Urban economist Joe Cortright examines the connection between gas prices and driving in the U.S. over the last two decades. Prices matter: increased gas prices results in decreased driving, providing the prices persist for the long-term.
"The relationship between prices and driving isn’t perfect and instantaneous," writes Cortright, director of Portland, Ore.-based City Observatory, for CityLab on Feb. 28.
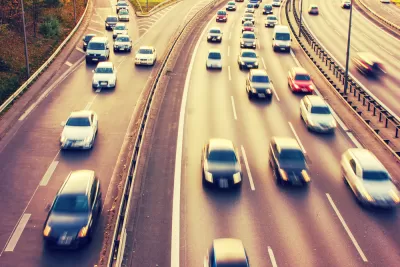
People make decisions about where to live, how far they’re willing to commute to work, whether to own a car (or a second car), and whether to use various other modes (cycling, transit, and walking) on a long-term basis. But, especially over time, prices influence all of these decisions.
To prove his point, Cortright examines four distinct time periods from 2000 to 2018 based on the price level of gasoline. An interactive graph from the Federal Reserve Economic Data (FRED), maintained by the research division of the Federal Reserve Bank of St. Louis, illustrates the inverse relationship between gas prices and vehicle miles traveled (VMT) for this time period. Note that gas prices are not adjusted for inflation and that VMT is measured per capita.
Four distinct phases in the price of gasoline and the attendant patterns of American driving
- 2000 through 2004 (4 years): Era of cheap gas and rising VMT: "'[P]eak driving' in the U.S. was in June 2005, when Americans drove 27.7 miles per person per day. At the time, gasoline cost an average of about $2.13 per gallon," writes Cortright.
- Phase 2: 2005 to July 2014: (9+ years): Expensive gas era. "By 2013, the typical American was driving about 25.7 miles, more than 2 miles per person per day less than at the peak."
- Phase 3: 2014-2016 (2 years): Cheaper gas again. Gas prices began falling in July 2014. After OPEC met in Vienna on November 27 and decided that maintaining market share preempted stabilizing gas prices, prices plummeted. "In April 2014, gas prices averaged more than $3.70 a gallon, and people drove an average of 25.7 miles per day. Some 22 months later, in February 2016, with prices averaging about $1.75 a gallon, consumers were driving about 26.7 miles per day, about 4 percent more."
- Phase 4: 2016-2018 (2 years): A rebound in gas prices:
Over the past two years, gas prices have again trended upward, rising from less than $2 per gallon to nearly $3 per gallon. As they’ve done so, the growth in per-capita driving has slowed, and—once again—reversed. Vehicle miles traveled per person peaked in late 2017, and have been trending down again since then.
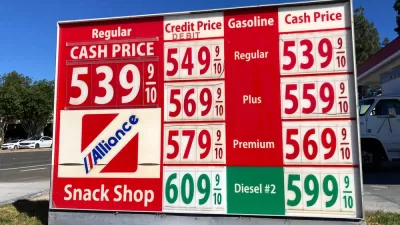
On March 3, the average gas price in the U.S. was $2.46 per gallon, according to AAA. The most recent data of vehicle miles traveled from the Federal Highway Administration's Traffic Volume Trends is for November 2018, showing a 0.3% increase compared with November 2017, which is also the same increase for cumulative travel for 2018. However, FHWA does not adjust for population growth.
Cortright's conclusion:
Sustained high prices for gasoline lead to real reductions in vehicle miles traveled, in pollution and in car deaths. If we price travel appropriately, consumers will make different decisions—ones that significantly reduce the social and environmental costs of car travel. Prices matter and should be at the heart of all of our efforts to cope with climate change and build stronger and safer communities.
Alternative perspective
"A brief analysis by the State Smart Transportation Initiative found a weak connection between VMT and gas prices, and a rather strong one between vehicle miles and urban density," wrote Eric Jaffe for CityLab in March 2012 (posted here).
Cortright's post is also available on City Observatory.
FULL STORY: The High Price of Cheap Gasoline


2016 Sets New U.S. Driving Record as Gas Prices Remain Low
So much for the 2015 record of 3.148 trillion miles. Last year saw a cumulative travel increase of 2.8 percent to 3.218 trillion miles, setting a new record as cheap gas contributed to increased driving.
'Are Gas Prices Too High?'
Nominal gas prices have never been higher. But are they too high? The question was posed by the ranking member of the Senate Committee on Energy & Natural Resources to the Secretary of the Interior during a committee hearing on May 19.
April FHWA Report Shows Americans Continue to Drive More
There is good news in the most recent Federal Highway Administration Travel Trends report—if you look hard enough.

Planetizen Federal Action Tracker
A weekly monitor of how Trump’s orders and actions are impacting planners and planning in America.

Congressman Proposes Bill to Rename DC Metro “Trump Train”
The Make Autorail Great Again Act would withhold federal funding to the system until the Washington Metropolitan Area Transit Authority (WMATA), rebrands as the Washington Metropolitan Authority for Greater Access (WMAGA).

The Simple Legislative Tool Transforming Vacant Downtowns
In California, Michigan and Georgia, an easy win is bringing dollars — and delight — back to city centers.

The States Losing Rural Delivery Rooms at an Alarming Pace
In some states, as few as 9% of rural hospitals still deliver babies. As a result, rising pre-term births, no adequate pre-term care and "harrowing" close calls are a growing reality.

The Small South Asian Republic Going all in on EVs
Thanks to one simple policy change less than five years ago, 65% of new cars in this Himalayan country are now electric.

DC Backpedals on Bike Lane Protection, Swaps Barriers for Paint
Citing aesthetic concerns, the city is removing the concrete barriers and flexposts that once separated Arizona Avenue cyclists from motor vehicles.
Urban Design for Planners 1: Software Tools
This six-course series explores essential urban design concepts using open source software and equips planners with the tools they need to participate fully in the urban design process.
Planning for Universal Design
Learn the tools for implementing Universal Design in planning regulations.
Smith Gee Studio
City of Charlotte
City of Camden Redevelopment Agency
City of Astoria
Transportation Research & Education Center (TREC) at Portland State University
US High Speed Rail Association
City of Camden Redevelopment Agency
Municipality of Princeton (NJ)