


Data visualizations illustrate the catastrophic consequences of single-digit global temperature increases.

Emily Cassidy presents a series of dynamic maps showing the effects of climate change on five especially vulnerable cities around the world. “Using Climate Central data hosted on Resource Watch, we can explore areas likely to be flooded by 0.5 and 1.5 meters of sea level rise,” writes Cassidy.
The cities include New Orleans and New York; Guangzhou, China; Mumbia, India; and Osaka, Japan. Each city faces its own challenges and threats. For example, Guangzhou and Osaka are big port cities and Mumbai, with 12 million people, is the most populous city in India.
Cassidy says that these maps show how potentially devastating rises in sea level will be for major cities:
It’s clear from these maps that every foot of sea level rise matters. The next few years are crucial for avoiding catastrophic damage. The good news is we have the tools we need to make far-reaching changes to how we power our homes and businesses, grow our food and design our cities.
Resource Watch also provides a platform for users to create maps related to a number of other climate change effects.
FULL STORY: 5 Major Cities Threatened by Climate Change and Sea Level Rise

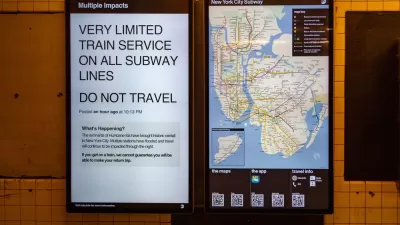
Ida Takes a Deadly Toll in the Northeast
Hurricane Ida passed through New Orleans, knocking out power causing extensive damage along the Gulf Coast. Then it moved to the Northeast, killing dozens of people with flooding caused by heavy rains.
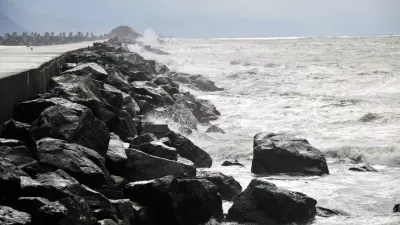
As Sea Levels Rise, Some Cities Will Be Saved While Others Will Be Left Behind
U.S. coastal cities need to prepare for the effects of climate change, but the pot of funding is limited. There’s no way around the fact that there will be winners and there will be losers.
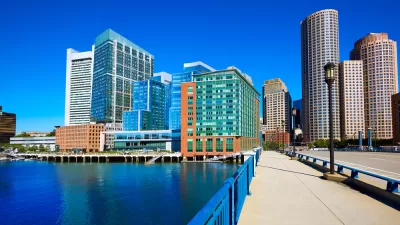
Boston’s Seaport District, Where Building Started Before Flood Preparation
The Boston waterfront has been booming, but the area is extremely vulnerable to climate change and rising sea levels. Measures to address those risks have come just recently.

Planetizen Federal Action Tracker
A weekly monitor of how Trump’s orders and actions are impacting planners and planning in America.

Maui's Vacation Rental Debate Turns Ugly
Verbal attacks, misinformation campaigns and fistfights plague a high-stakes debate to convert thousands of vacation rentals into long-term housing.

San Francisco Suspends Traffic Calming Amidst Record Deaths
Citing “a challenging fiscal landscape,” the city will cease the program on the heels of 42 traffic deaths, including 24 pedestrians.

Defunct Pittsburgh Power Plant to Become Residential Tower
A decommissioned steam heat plant will be redeveloped into almost 100 affordable housing units.

Trump Prompts Restructuring of Transportation Research Board in “Unprecedented Overreach”
The TRB has eliminated more than half of its committees including those focused on climate, equity, and cities.

Amtrak Rolls Out New Orleans to Alabama “Mardi Gras” Train
The new service will operate morning and evening departures between Mobile and New Orleans.
Urban Design for Planners 1: Software Tools
This six-course series explores essential urban design concepts using open source software and equips planners with the tools they need to participate fully in the urban design process.
Planning for Universal Design
Learn the tools for implementing Universal Design in planning regulations.
Heyer Gruel & Associates PA
JM Goldson LLC
Custer County Colorado
City of Camden Redevelopment Agency
City of Astoria
Transportation Research & Education Center (TREC) at Portland State University
Jefferson Parish Government
Camden Redevelopment Agency
City of Claremont