


The calculator can help transportation advocates and agencies project how many additional miles and emissions a highway widening project would create.
A new tool from nonprofit RMI and a consortium of partners including Transportation for America and the National Resources Defense Council "draws on formulas sourced from decades of proven scientific literature to deliver detailed, community-specific induced demand forecasts with the click of a button." The State Highway Induced Frequency of Travel (SHIFT) Calculator "gives advocates the tools they need to instantly show the real impacts of proposed highway expansions in their communities," writes Kea Wilson, providing a valuable resource for showing the real-world impact of the well-documented but poorly understood phenomenon of induced demand.
"Sustainable transportation advocates and forward-thinking professionals alike have known since at least 1932 that expanding highways to cure congestion almost always has the opposite effect," writes Wilson, but "many of them haven’t been able to quickly quantify exactly how much additional driving a specific project would encourage, or exactly how much all those new vehicle miles traveled will exacerbate the climate crisis — until now."
The tool comes at a crucial time, with billions of dollars for road funding promised in the federal infrastructure bill. The calculator's creators hope it will help state DOTs develop more accurate projections that show the true costs and impacts of road widening.
FULL STORY: New ‘Induced Demand’ Calculator Shows Exactly How Much Driving Your City’s Highway Expansion Will Encourage

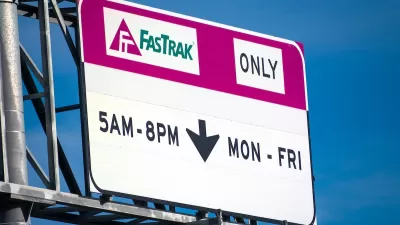
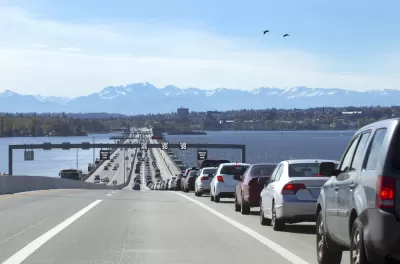
Report: Traffic Slower Near Bay Area Express Lanes
Highway 101 was expanded to add express lanes with the promise of reducing congestion for all of the roadway’s users.
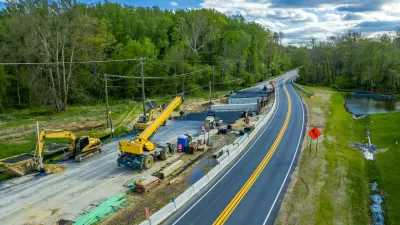
Study: Cost of Expanding Roads Outweighs Benefits
New research shows that the economic benefits of roadbuilding projects don’t come close to exceeding most projects’ costs.

Critics Say New York Highway Expansion Plans Oppose Climate Goals
Plans to widen some roads are drawing backlash from transit advocates who say they will lead to an increase in congestion and truck traffic.

Maui's Vacation Rental Debate Turns Ugly
Verbal attacks, misinformation campaigns and fistfights plague a high-stakes debate to convert thousands of vacation rentals into long-term housing.

Planetizen Federal Action Tracker
A weekly monitor of how Trump’s orders and actions are impacting planners and planning in America.

In Urban Planning, AI Prompting Could be the New Design Thinking
Creativity has long been key to great urban design. What if we see AI as our new creative partner?

Baker Creek Pavilion: Blending Nature and Architecture in Knoxville
Knoxville’s urban wilderness planning initiative unveils the "Baker Creek Pavilion" to increase the city's access to green spaces.

Pedestrian Deaths Drop, Remain Twice as High as in 2009
Fatalities declined by 4 percent in 2024, but the U.S. is still nowhere close to ‘Vision Zero.’

King County Supportive Housing Program Offers Hope for Unhoused Residents
The county is taking a ‘Housing First’ approach that prioritizes getting people into housing, then offering wraparound supportive services.
Urban Design for Planners 1: Software Tools
This six-course series explores essential urban design concepts using open source software and equips planners with the tools they need to participate fully in the urban design process.
Planning for Universal Design
Learn the tools for implementing Universal Design in planning regulations.
planning NEXT
Appalachian Highlands Housing Partners
Mpact (founded as Rail~Volution)
City of Camden Redevelopment Agency
City of Astoria
City of Portland
City of Laramie