


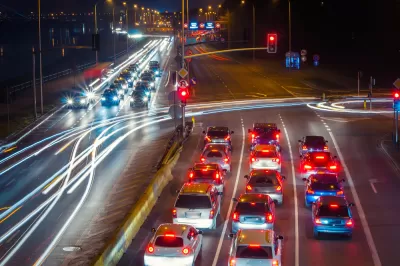
The map of metropolitan areas that drive least, and thus emit fewer greenhouse gas emissions, has been completely redrawn by the pandemic, according to a recent report.
Kristin Musulin reports:
StreetLight Data has released its 2020 U.S. Transportation Climate Impact Index, which ranks the nation's 100 most populous metro areas on vehicle miles traveled (VMT), mileage of bike and pedestrian commuting, per-capita transit use, population density and circuity.
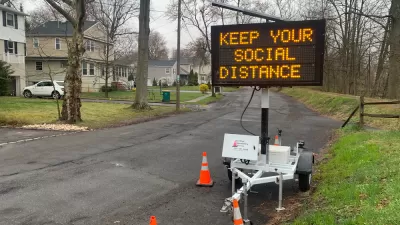
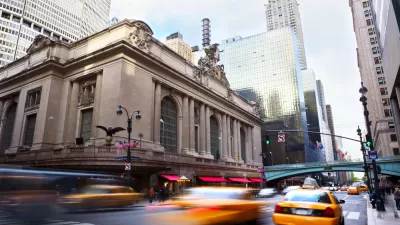
This year's reports reflects a major shakeup from the 2019 list, thanks to the wild shifts in transportation patterns due to public health restrictions and the resulting economic fallout during the pandemic. Only two cities, San Francisco and New York, appear on both the 2020 and the 2019 list according to Musulin.
"StreetLight Data recognized the COVID-19 pandemic has had an 'unprecedented impact' on vehicle miles traveled (VMT) nationally, which in turn impacted the rankings," writes Musulin.
Overall, VMT is still down compared to pre-pandemic times, continuing a trend identified in a report released by StreetLight Data this summer.
Phaedra Hise, StreetLight Data's director of content, is quoted in the article adding the caveat that it is too soon to tell whether these changes will be permanent, but the pandemic travel data does reveal some hope that localities can decouple VMT from economic growth (measured by GDP).
FULL STORY: COVID ushers new cities to top of VMT climate index

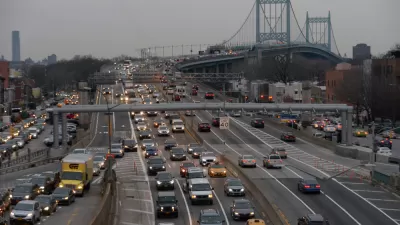
Report: Vehicle Miles Traveled Almost Fully Returned to Pre-Pandemic Levels
Reports last week that the U.S. economy is about 30 percent smaller than before the pandemic aren't reflected in driving trends.
Greenhouse Gas Emissions Reduced 17% Worldwide in April, Study Says
A recently published study predicts a 4 to 7 percent decline in greenhouse gas emissions for 2020 compared to 2019.
Ranking the Climate Impact of Transportation in the 100 Largest U.S. Metro Areas
This performance ranking separates the fakers from the legit operation to reduce carbon emissions from transportation.

Planetizen Federal Action Tracker
A weekly monitor of how Trump’s orders and actions are impacting planners and planning in America.

Congressman Proposes Bill to Rename DC Metro “Trump Train”
The Make Autorail Great Again Act would withhold federal funding to the system until the Washington Metropolitan Area Transit Authority (WMATA), rebrands as the Washington Metropolitan Authority for Greater Access (WMAGA).

The Simple Legislative Tool Transforming Vacant Downtowns
In California, Michigan and Georgia, an easy win is bringing dollars — and delight — back to city centers.

The States Losing Rural Delivery Rooms at an Alarming Pace
In some states, as few as 9% of rural hospitals still deliver babies. As a result, rising pre-term births, no adequate pre-term care and "harrowing" close calls are a growing reality.

The Small South Asian Republic Going all in on EVs
Thanks to one simple policy change less than five years ago, 65% of new cars in this Himalayan country are now electric.

DC Backpedals on Bike Lane Protection, Swaps Barriers for Paint
Citing aesthetic concerns, the city is removing the concrete barriers and flexposts that once separated Arizona Avenue cyclists from motor vehicles.
Urban Design for Planners 1: Software Tools
This six-course series explores essential urban design concepts using open source software and equips planners with the tools they need to participate fully in the urban design process.
Planning for Universal Design
Learn the tools for implementing Universal Design in planning regulations.
Smith Gee Studio
City of Charlotte
City of Camden Redevelopment Agency
City of Astoria
Transportation Research & Education Center (TREC) at Portland State University
US High Speed Rail Association
City of Camden Redevelopment Agency
Municipality of Princeton (NJ)