Reports last week that the U.S. economy is about 30 percent smaller than before the pandemic aren't reflected in driving trends.


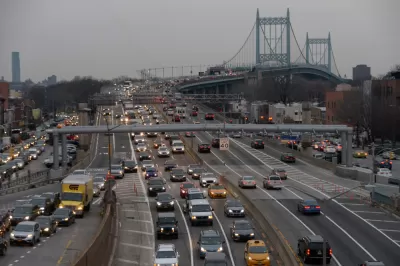
Cailin Crowe shares data from the Trip Reduction Index, created by StreetLight Data and Boston Consulting Group, to track vehicle miles traveled on U.S. roads during the pandemic.
"The index found the national average in VMT dropped 72% from the beginning of March through April 7, but rural counties have now fully recovered to pre-COVID VMT levels while urban counties have reached 90% recovery," according to Crowe.
"The analysis also found that the top three contributing factors to VMT reduction profiles are household income, population density and the number of professional service jobs, which all tend to be more prevalent in urban areas than rural areas."
As the coronavirus has spread, and continued to spread, around the nation, the low point in VMT was achieved on Easter Sunday (April 12). The article notes that with these dramatic changes in the driving patterns of Americans, similar new trends have emerged in bikes, transit, and other mobility services. Recent data reported by the Kinder Institute of Urban Research shows that as VMT has risen again as the pandemic has lingered into its fourth month, infection rates have also risen. While the data stops short of proving any causation, recent research has also served to allay some of the early fears of public transit as a vector for infection.
Specific VMT trends for geographic regions are also pointed out in the source article.
Read the full story: US roadways nearly restored to pre-pandemic VMT levels

Where the Pandemic Has Scrambled Traffic Patterns
The map of metropolitan areas that drive least, and thus emit fewer greenhouse gas emissions, has been completely redrawn by the pandemic, according to a recent report.
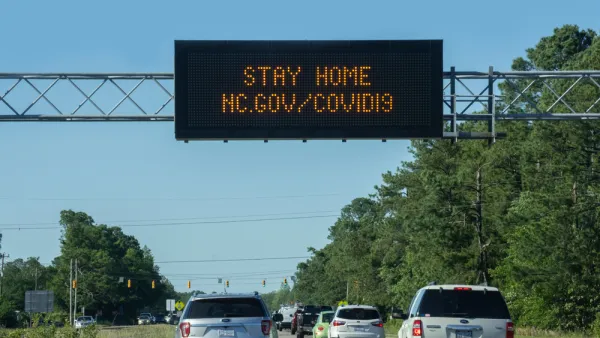
Americans Aren't Likely to Start Driving at Pre-Pandemic Levels Soon
Vehicle miles traveled (VMT) and gasoline production trends point to VMT in the United States staying ten to 12 percent lower than in 2019 for the next few months, at least.
Driving Still Below Pre-Pandemic Levels in the U.S., Study Says
Congestion is increasing much faster than vehicle miles traveled, suggesting that the “new normal” of hybrid work and an influx of suburban residents is taking a toll on the nation's transportation system.
Planetizen Federal Action Tracker
A weekly monitor of how Trump’s orders and actions are impacting planners and planning in America.
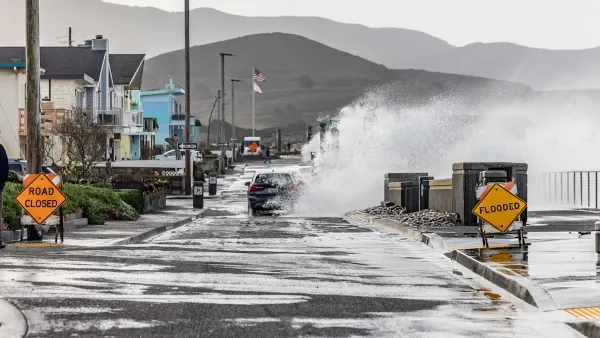
California plans to bury El Niño’s downpour
If the state plays its cards right, it may be able to store a billion acre-feet of El Niño’s water in aquifers.

Chicago breaks ground on $3 billion megadevelopment
The new neighborhood, titled Foundry Park, will one day host 3,700 residences.

Satanic place names
From streams and lakes to valleys and canyons, I mapped more than 1,000 places named after the Devil.

California High-Speed Rail Authority CEO resigns after $600,000 scandal
Under Ian Choudri, the authority used taxpayer dollars to fund first class flights and trips to nightclubs.

Want to study the Missouri River? Soon, you may need unanimous approval from 10 states
Legislation would require 10 governors’ permission to study or build projects moving water outside the basin.

FREE Course: Walkable City 1: Why Walkability?
After describing his path towards focusing on walkability as the essence of good planning, Jeff Speck marches through his five principal reasons for making more walkable places.
Reinventing Malls: Planning Alchemy—Turning Gray Fields Into Gold
The course focuses on the opportunities and imperatives that shape reinvention of mall sites.

City of Rosemead
Rutgers University, Edward J. Bloustein School of Planning and Public Policy
One Hundred Miles
Hunter College, City University of New York (CUNY)
The Architects Foundation
University of Cincinnati Online
City of Cambridge
Montrose County
The Pocatello Development Authority