


This performance ranking separates the fakers from the legit operation to reduce carbon emissions from transportation.
Streetlight Data released its "2020 U.S. Transportation Climate Impact Index," which ranks the 100 largest metropolitan areas on climate impact using performance-based transportation metrics.
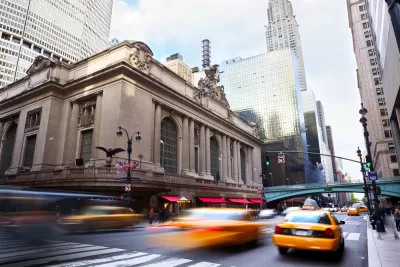
As explained in an article that introduces the index, the rankings boil down to the difference between car travel and low-carbon alternative modes of travel. Thus, the number one metropolitan area probably won't come as a surprise: New York City-Newark-Jersey City. Coming in second is San Francisco-Oakland-Hayward, and coming in third is Madison, Wisconsin.
Streetlight Data released a package of data and articles to help offer insight into the details of the index beyond the rankings. So the entire list of metropolitan areas and rankings by key metrics in the index are also available.
The decline of the coal industry in recent years has pushed transportation to the top of the list as the largest emitter of greenhouse gas by sector. Streetlight Data puts a finer point on the origins of that leading source of greenhouse gases.
FULL STORY: 2020 U.S. Transportation Climate Impact Index


Where the Pandemic Has Scrambled Traffic Patterns
The map of metropolitan areas that drive least, and thus emit fewer greenhouse gas emissions, has been completely redrawn by the pandemic, according to a recent report.
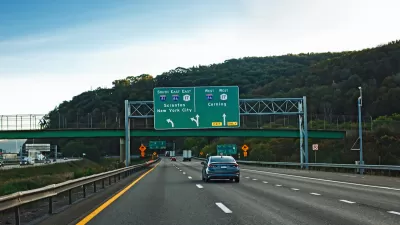
Proposed New York Bill Would Align Transportation Projects With Driving Reduction Goals
If passed, the law would require all highway projects to show how they would reduce VMT or mitigate their impact.
Connecting Land Use and Transportation Planning to Save the Climate
The United States will have to make major changes to long-standing land use and transportation paradigms to prevent the worst outcomes of climate change. How to make those changes was the subject of a recent podcast.

Planetizen Federal Action Tracker
A weekly monitor of how Trump’s orders and actions are impacting planners and planning in America.

Chicago’s Ghost Rails
Just beneath the surface of the modern city lie the remnants of its expansive early 20th-century streetcar system.
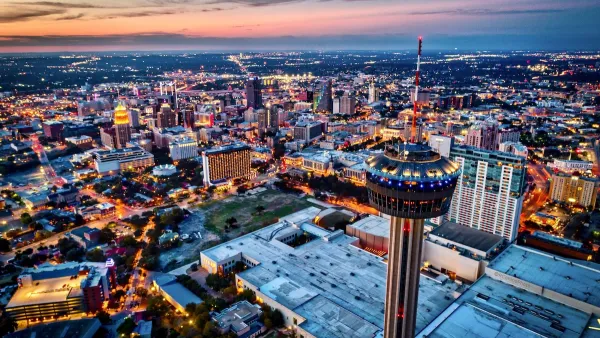
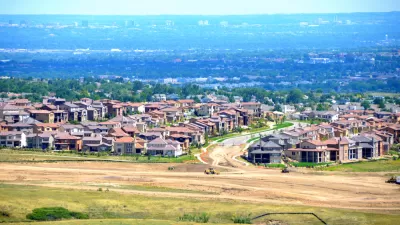
San Antonio and Austin are Fusing Into one Massive Megaregion
The region spanning the two central Texas cities is growing fast, posing challenges for local infrastructure and water supplies.

Since Zion's Shuttles Went Electric “The Smog is Gone”
Visitors to Zion National Park can enjoy the canyon via the nation’s first fully electric park shuttle system.

Trump Distributing DOT Safety Funds at 1/10 Rate of Biden
Funds for Safe Streets and other transportation safety and equity programs are being held up by administrative reviews and conflicts with the Trump administration’s priorities.

German Cities Subsidize Taxis for Women Amid Wave of Violence
Free or low-cost taxi rides can help women navigate cities more safely, but critics say the programs don't address the root causes of violence against women.
Urban Design for Planners 1: Software Tools
This six-course series explores essential urban design concepts using open source software and equips planners with the tools they need to participate fully in the urban design process.
Planning for Universal Design
Learn the tools for implementing Universal Design in planning regulations.
planning NEXT
Appalachian Highlands Housing Partners
Mpact (founded as Rail~Volution)
City of Camden Redevelopment Agency
City of Astoria
City of Portland
City of Laramie