


One of the best tools for understanding the consequences and potential of transit planning has been recently updated.
The team at TransitCenter has announced updates to the Transit Insights visual tool, which tracks the vital signs of transit: ridership, service hours, fares, and more. The update promises new data and improved usability.
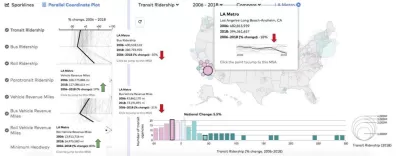
As an example of the new usefulness of the Transit Insights tool, the Los Angeles County Metropolitan Transportation Authority is offered:
Take LA Metro, the main transit agency in Los Angeles. Metro’s overall vehicle revenue miles (VRM) increased 19% from 2006 to 2018. Usually people respond to greater levels of service by riding transit more, but LA Metro’s overall transit ridership actually decreased 18% during this same period.
Using Transit Insights to isolate VRM by mode, the dynamics of these contradictory trends are revealed.
Breaking down the change in service volume by mode, bus service miles actually decreased 21%, while rail increased 80%. That helps explain why bus ridership, which accounts for most trips people take on LA Metro, declined 30% over this period.
That context informs an understanding of the news that Metro L.A. in June released an updated draft of its 2020 Long Range Transportation Plan, which would invest $400 billion over 30 years in the region's transportation system.
The article includes all of the rest of the new features to be found on Transit Insights, highlighting the Orange Line on the Dallas Area Rapid Transit system (which recently restored 90 percent of its pre-pandemic service levels) for an example of how to unlock demographic insights from the tool.
FULL STORY: Say Hello to the New and Improved Transit Insights!

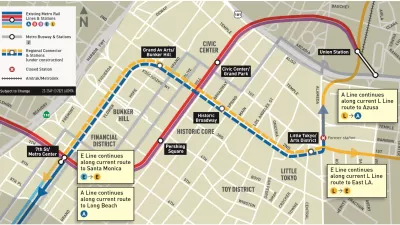
Newly Opened Regional Connector Redefines Light Rail Transit in Los Angeles
Three rail lines have become two rail lines in Los Angeles, providing one-seat rides from four corners of Los Angeles County.
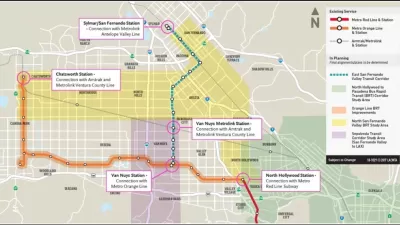
Rail Transit Plans Would Connect L.A.’s South Bay to the Regional Rail System
Two new transit extensions promise several new routes for South Bay residents to access the Los Angeles region’s transit system.
$1.9 Billion in State Budget Surplus Requested for L.A. Transit Projects
L.A. transit officials hope the state budget surplus can be used to fund regional transit project, including one highly anticipated light rail project that broke ground on Friday, December 2.

Planetizen Federal Action Tracker
A weekly monitor of how Trump’s orders and actions are impacting planners and planning in America.

Map: Where Senate Republicans Want to Sell Your Public Lands
For public land advocates, the Senate Republicans’ proposal to sell millions of acres of public land in the West is “the biggest fight of their careers.”

Restaurant Patios Were a Pandemic Win — Why Were They so Hard to Keep?
Social distancing requirements and changes in travel patterns prompted cities to pilot new uses for street and sidewalk space. Then it got complicated.

Platform Pilsner: Vancouver Transit Agency Releases... a Beer?
TransLink will receive a portion of every sale of the four-pack.

Toronto Weighs Cheaper Transit, Parking Hikes for Major Events
Special event rates would take effect during large festivals, sports games and concerts to ‘discourage driving, manage congestion and free up space for transit.”

Berlin to Consider Car-Free Zone Larger Than Manhattan
The area bound by the 22-mile Ringbahn would still allow 12 uses of a private automobile per year per person, and several other exemptions.
Urban Design for Planners 1: Software Tools
This six-course series explores essential urban design concepts using open source software and equips planners with the tools they need to participate fully in the urban design process.
Planning for Universal Design
Learn the tools for implementing Universal Design in planning regulations.
Heyer Gruel & Associates PA
JM Goldson LLC
Custer County Colorado
City of Camden Redevelopment Agency
City of Astoria
Transportation Research & Education Center (TREC) at Portland State University
Camden Redevelopment Agency
City of Claremont
Municipality of Princeton (NJ)