


Recently released travel data show Americans returning to their cars as the economic recovery deepens. Alternative forms of transportation are not attracting new users.

How fast is the transportation world changing? It's time to take a mid-year look at the data and see what we can discern. The newest American Community Survey results from 2016, and more current and better data on several transportation metrics (courtesy of web-based data collection and reporting), allow a much more accessible understanding of current trends. Of course, details like Harvey and Irma might impact trends going forward.
Looking first at key contributing factors, population growth continues at a modest pace; nonetheless, it's a pace that when compounded will continue to drive long-term travel demand growth. Employment growth has slowed but outpaces population growth. GDP is relatively strong. The gas price year-over-year declines enjoyed the prior two years have played out, but fuel prices still remain attractive, particularly in light of continuing improvements in overall fleet efficiency. Vehicle sales have softened but vehicle ownership continues to grow—outpacing inflation and employment growth. The collective consequence of these and myriad other factors that influence travel demand have resulted in vehicle miles of travel (VMT) growth running about twice the rate of population growth so far in 2017. Airline travel growth is even stronger and Amtrak ridership has ticked up as well. The laggard in travel is public transportation, where the drop in ridership seems to be accelerating.
Travel Trends and Context
|
2015 vs 2014 |
2016 vs 2015 |
2017 YTD vs 2016 |
Months |
Source |
|
|
U.S. Population |
0.8% |
0.5% |
0.7% |
6 |
Census |
|
Total Employment |
1.7% |
1.7% |
1.0% |
8 |
BLS |
|
Real GDP |
2.9% |
1.5% |
2.8% |
6 |
BEA (3rd estimate) |
|
Gas Price |
-29.2% |
-14.9% |
12.0% |
9 |
EIA |
|
Registered Cars and Light Trucks |
2.1% |
1.5% |
3.0% |
12 proj. |
Hedges Co. |
|
Light Vehicle Sales |
5.7% |
0.4% |
-2.8% |
8 |
BEA |
|
VMT |
3.5% |
2.8% |
1.5% |
7 |
FHWA |
|
Public Transit Ridership |
-1.0% to -2.2% |
-2.1% to -2.3% |
-3.1% to -3.0% |
3, 6 |
APTA and NTD |
|
Amtrak Ridership (FY) |
-0.3% |
1.6% |
2.1% |
6 |
Amtrak |
|
Airline Passengers |
5.3% |
3.9% |
3.5% |
6 |
So what can we learn from this data? After extraordinarily sophisticated numerical analysis utilizing any number of sophisticated methodologies and data transformations... No strike that. I stared at the data for a while and thought about what has been going on these past six years. Earlier in the recovery, there seemed to be something of a rebound jump in both airline and vehicle travel. The economic recovery no doubt contributed, but there may have also been some catch-up travel as family visits, vacations, and other travel producing activities that were forgone during the recession were made up. Friends and relatives were visited, a replacement for that unreliable car enabled that trip with the kids to Disney before they outgrew the desire, and folks started looking for new houses, jobs, and cars, while some spent their gas price savings on additional trips for shopping or eating out.
ACS data confirm the rebound in vehicle ownership with the share of households with no vehicle available dropping back to the level in 2007, 0.6% below its peak in 2011. As one would expect given the growth in travel, the average commute time has resumed its steady climb, now 1.3 minutes greater than it was in 2007 on average. Slightly fewer households have zero workers.
American Commuting, Ten Year Trends
|
2007 |
2008 |
2009 |
2010 |
2011 |
2012 |
2013 |
2014 |
2015 |
2016 |
|
|
VEHICLES AVAILABLE – U.S. |
||||||||||
|
No vehicles available |
8.7% |
8.8% |
8.9% |
9.1% |
9.3% |
9.2% |
9.1% |
9.1% |
8.9% |
8.7% |
|
1 vehicle available |
33.1% |
33.4% |
33.7% |
33.8% |
34.1% |
34.1% |
33.9% |
33.7% |
33.5% |
33.2% |
|
2 vehicles available |
38.1% |
37.8% |
37.6% |
37.6% |
37.5% |
37.3% |
37.3% |
37.3% |
37.2% |
37.1% |
|
3 or more vehicles available |
20.1% |
20.0% |
19.9% |
19.5% |
19.1% |
19.3% |
19.7% |
19.9% |
20.3% |
21.0% |
|
ZERO-WORKER HOUSEHOLDS |
||||||||||
|
U.S. |
25.8% |
24.5% |
26.3% |
27.2% |
27.5% |
27.3% |
27.0% |
26.9% |
26.8% |
26.6% |
|
MEAN TRAVEL TIME TO WORK |
||||||||||
|
U.S. (mins) |
25.3 |
25.5 |
25.1 |
25.3 |
25.5 |
25.7 |
25.8 |
26.0 |
26.4 |
26.6 |
Source: ACS 2016
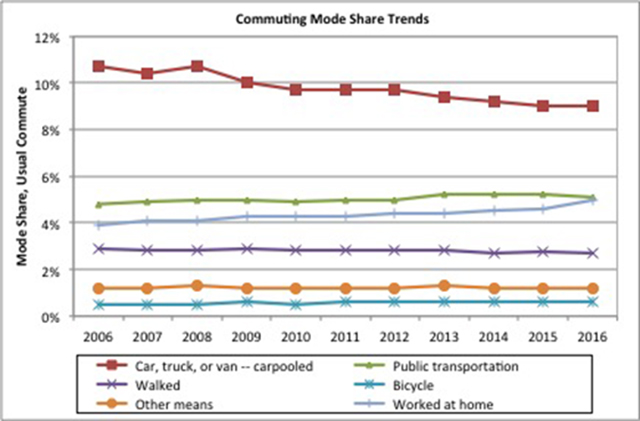
The other key measure from the American Community Survey is the "usual" means of commuting to work. The biggest change in 2016 was a significant spike in "work at home," which has jumped to 5%, nearly equal to the share of folks who "usually" commute via transit, at 5.1%. The gig economy, older workers retiring from steady employment but continuing to work as consultants out of the house, and continuing growth in the information economy that creates job opportunities more conducive to work at home may be contributing as might be noticeable increases in congestion particularly in rapidly growing communities.
The multi-decade decline in carpooling finally showed signs of stabilizing. Public transit ticked down a tad, consistent with the drops in ridership noted earlier. Biking and walking are stable in spite of the degree of attention they receive from the planning and transportation research communities. Driving alone has fluctuated modestly over the past decade, ranging between 76 and 77 percent. The data trends do not suggest any transformative changes in travel in the near term absent some intervening event(s).
The last information item is data extracted from the consumer expenditure survey regarding spending for transportation. Most noticeable in the ten-year trend is the fact that transportation spending as a share of consumer unit expenditures has decreased over time. Expenditures in 2016 were less than 16% of household spending. In 2016 dollars, household spending for transportation has declined approximately 10% in the past decade. Average household spending on transportation was approximately $9,000 annually, less than $4,800 per adult. Low fuel prices, low interest rates, and perhaps inadequate extractions to fund maintenance and enhancement of transportation infrastructure might explain some of the economizing on travel, as might substitution of communication for travel such as online shopping and working at home.
Consumer Expenditures, Ten Year Trends
|
Item |
2007 |
2008 |
2009 |
2010 |
2011 |
2012 |
2013 |
2014 |
2015 |
2016 |
|
Average Annual Expenditures |
$49,638 |
$50,486 |
$49,067 |
$48,109 |
$49,705 |
$51,442 |
$51,100 |
$53,495 |
$55,978 |
$57,311 |
|
Food |
$6,133 |
$6,443 |
$6,372 |
$6,129 |
$6,458 |
$6,599 |
$6,602 |
$6,759 |
$7,023 |
$7,203 |
|
Housing |
$16,920 |
$17,109 |
$16,895 |
$16,557 |
$16,803 |
$16,887 |
$17,148 |
$17,798 |
$18,409 |
$18,886 |
|
Housing Share of Expenditures |
34.1% |
33.9% |
34.4% |
34.4% |
33.8% |
32.8% |
33.6% |
33.3% |
32.9% |
33.0% |
|
Apparel and services |
$1,881 |
$1,801 |
$1,725 |
$1,700 |
$1,740 |
$1,736 |
$1,604 |
$1,786 |
$1,846 |
$1,803 |
|
Healthcare |
$2,853 |
$2,976 |
$3,126 |
$3,157 |
$3,313 |
$3,556 |
$3,631 |
$4,290 |
$4,342 |
$4,612 |
|
Entertainment |
$2,698 |
$2,835 |
$2,693 |
$2,504 |
$2,572 |
$2,605 |
$2,482 |
$2,728 |
$2,842 |
$2,913 |
|
Personal care products and services |
$588 |
$616 |
$596 |
$100 |
$115 |
$109 |
$608 |
$645 |
$683 |
$707 |
|
Transportation Expenditures |
$8,758 |
$8,604 |
$7,658 |
$7,677 |
$8,293 |
$8,998 |
$9,004 |
$9,073 |
$9,503 |
$9,049 |
|
Transportation Expenditures 2016$ |
$10,140 |
$9,591 |
$8,568 |
$8,448 |
$8,850 |
$9,406 |
$9,275 |
$9,199 |
$9,623 |
$9,049 |
|
Transportation Share of Exp. |
17.6% |
17.0% |
15.6% |
16.0% |
16.7% |
17.5% |
17.6% |
17.0% |
17.0% |
15.8% |
|
Vehicle purchases (net outlay) |
$3,244 |
$2,755 |
$2,657 |
$2,588 |
$2,669 |
$3,210 |
$3,271 |
$3,301 |
$3,997 |
$3,634 |
|
Gasoline and motor oil |
$2,384 |
$2,715 |
$1,986 |
$2,132 |
$2,655 |
$2,756 |
$2,611 |
$2,468 |
$2,090 |
$1,909 |
|
Other vehicle expenses |
$2,592 |
$2,621 |
$2,536 |
$2,464 |
$2,454 |
$2,490 |
$2,584 |
$2,723 |
$2,756 |
$2,884 |
|
Public and other transportation |
$538 |
$513 |
$479 |
$493 |
$516 |
$542 |
$537 |
$581 |
$661 |
$623 |
|
Transportation Spending per Adult |
$4,609 |
$4,528 |
$4,031 |
$4,041 |
$4,365 |
$4,736 |
$4,739 |
$4,775 |
$5,002 |
$4,763 |
|
Transportation Spending per Adult in 2016$ |
$5,337 |
$5,048 |
$4,510 |
$4,446 |
$4,658 |
$4,950 |
$4,881 |
$4,842 |
$5,065 |
$4,763 |
Source: Consumer Expenditure Survey, U.S. Bureau of Labor Statistics, August, 2017
Collectively, one might discern several observations from the data. Transit, biking, and walking are not thriving. While various initiatives might be benefiting targeted persons and locations, the collective initiatives are not moving the dial in terms of overall travel behavior. It is important to note that there is significant variation across metropolitan areas with respect to travel. While national averages are quite stable, there might still be significant and different changes in various markets.
The intransigence of behavior would suggest that either the tactics need to change and/or the merits and value of various initiatives need to be carefully scrutinized in the context of their effectiveness and the collective public will of travelers. Transportation is a declining share of household expenditures in dollars. Expenditures in time seem to be ticking up with increased congestion and the cost in accidents and fatalities increased in the past few years. Travel behavior was affected by the economy, with a spike in zero car households, increased fuel expenditures, slowing car sales, and increased transit use during the recession, but these trends reversed when the recovery took hold.
My high priority watch list would be “work at home” and transit commute shares, along with average travel time to work.
While the trends presented are national averages, the reader should review the source data before attributing statistical significance to any year-to-year change. The opinions are those of the author—or maybe not—but are intended to provoke reflection and do not reflect the policy positions of any associated entities or clients. [email protected].


New Commute Data: Telecommuting on the Rise
The news from the most recent American Community Survey data isn't entirely bad for advocates hoping that Americans will switch to more efficient, less impactful forms of commuting.
The Most Popular Forms of Alternative Transportation
When it comes to the Census, the term "alternative transportation" makes perfect sense. Eric Jaffe looks at the 15 metropolitan areas with the lowest auto commuting and describes the most popular alternatives.
How to Reduce Excess Vehicle Travel
Some experts claim that remote work is the most effective way to reduce vehicle travel, but my research indicates that improving and encouraging walking, bicycling, and public transit can provide larger impacts and benefits.

Planetizen Federal Action Tracker
A weekly monitor of how Trump’s orders and actions are impacting planners and planning in America.

Maui's Vacation Rental Debate Turns Ugly
Verbal attacks, misinformation campaigns and fistfights plague a high-stakes debate to convert thousands of vacation rentals into long-term housing.

Restaurant Patios Were a Pandemic Win — Why Were They so Hard to Keep?
Social distancing requirements and changes in travel patterns prompted cities to pilot new uses for street and sidewalk space. Then it got complicated.

In California Battle of Housing vs. Environment, Housing Just Won
A new state law significantly limits the power of CEQA, an environmental review law that served as a powerful tool for blocking new development.

Boulder Eliminates Parking Minimums Citywide
Officials estimate the cost of building a single underground parking space at up to $100,000.

Orange County, Florida Adopts Largest US “Sprawl Repair” Code
The ‘Orange Code’ seeks to rectify decades of sprawl-inducing, car-oriented development.
Urban Design for Planners 1: Software Tools
This six-course series explores essential urban design concepts using open source software and equips planners with the tools they need to participate fully in the urban design process.
Planning for Universal Design
Learn the tools for implementing Universal Design in planning regulations.
Heyer Gruel & Associates PA
JM Goldson LLC
Custer County Colorado
City of Camden Redevelopment Agency
City of Astoria
Transportation Research & Education Center (TREC) at Portland State University
Jefferson Parish Government
Camden Redevelopment Agency
City of Claremont