


The International Energy Agency found that China and India were responsible for 40 percent of the increased energy demand. The biggest decrease in carbon dioxide emissions came from the U.S., largely due to increased use of renewables.

The decline in carbon dioxide emissions in the U.S. last year "was all the more notable given President Trump’s outspoken opposition to global attempts to curb greenhouse gas emissions and his plans to withdraw from the Paris deal," reports Benjamin Storrow of E&E News for Scientific American on March 24.
Not all energy and emission sectors performed well in the United States though. One of the factors blamed for a 1.6 percent increase in global oil demand, "a rate that was more than twice the annual average seen over the last decade," was American consumer preference for sport utility vehicles over more fuel-efficient cars, according to the International Energy Agency's first Global Energy and CO2 Status Report– released March 22, 2018.
The share of light trucks in the U.S. "increased from 47% in 2011 to around 60% of total sales in 2017, bringing up the share of these vehicles in the total passenger car fleet to almost half," though a March 5 Planetizen post indicates that sport utility vehicle sales in the U.S. increased from 61% of total auto sales in 2016 to 67% last year. "It is also a factor in the European Union, where oil demand increased by 2%, the highest rate of growth since 2001.
Overall, global energy demand grew by 2.1% in 2017, according to IEA preliminary estimates, more than twice the growth rate in 2016, while global energy-related CO2 emissions grew by 1.4% in 2017, notes the report's overview.
“It’s not good news,” said Rachel Cleetus, policy director for the climate and energy program at the Union of Concerned Scientists, writes Storrow.
“It certainly is a sign that we have a great deal of work to do to meet the commitments that countries made in Paris to limit emissions and the harmful effects of climate change.”
Last year’s growth came after three years of flat emissions and contrasts with the sharp reduction needed to meet the goals of the Paris Agreement on climate change.
The report covers the annual change in all four energy sectors. "Over 70% of global energy demand growth was met by oil, natural gas and coal, while renewables accounted for almost all of the rest." In addition to the aforementioned 1.6% (1.5 million barrels) increase in global oil demand:
- Natural gas demand increased 3%, reaching a record share of 22% in total energy demand, with 30% of new demand coming from China.
- "Global coal demand rose about 1% in 2017, reversing the declining trend seen over the last two years," with most coming from Asia, "almost entirely driven by an increase in coal-fired electricity generation."
- "Renewables saw the highest rate of growth of any energy source in 2017 and met around a quarter of global energy demand growth last year," experiencing a 6.3% increase in renewables-based power generation. However, "[f]ossil fuels accounted for 81% of total energy demand in 2017, a level that has remained stable for more than three decades."
"The robust global economy pushed up energy demand last year, which was mostly met by fossil fuels, while renewables made impressive strides,” said Dr Fatih Birol, the IEA’s Executive Director. “The significant growth in global energy-related carbon dioxide emissions in 2017 tells us that current efforts to combat climate change are far from sufficient."
Hat tip to Ed Mainland.
FULL STORY: Global energy demand grew by 2.1% in 2017, and carbon emissions rose for the first time since 2014


Climate Concerns Largely Absent in Auto Showrooms
A consumer survey found that less than a third of respondents considered carbon emissions or the environment when they last purchased a motor vehicle, yet three-quarters of Americans consider climate change a major problem or crisis.
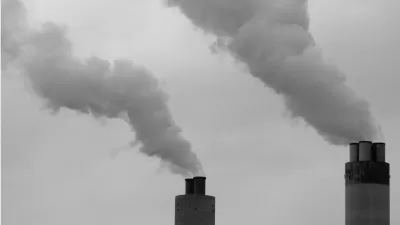
No Good News for Climate Stabilization From a New Worldwide Energy Report
Last month, the Paris-based International Energy Agency released its annual "Global Energy & CO2 Status Report." Energy consumption grew 2.3 percent with fossil fuels accounting for 70 percent on the increase. CO2 emissions jumped 1.7 percent.

Major Increase in Global Carbon Emissions Projected for 2018
The report from the Global Carbon Project, an international group of scientists who track greenhouse gas emissions, comes as a surprise as emissions had been relatively flat for the last four years. Global emissions this year will increase 2.7%.

Planetizen Federal Action Tracker
A weekly monitor of how Trump’s orders and actions are impacting planners and planning in America.
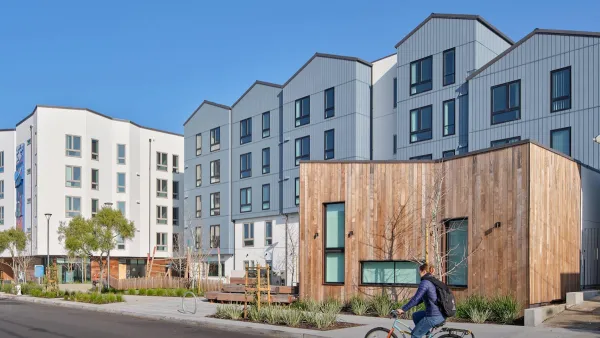
San Francisco's School District Spent $105M To Build Affordable Housing for Teachers — And That's Just the Beginning
SFUSD joins a growing list of school districts using their land holdings to address housing affordability challenges faced by their own employees.

The Tiny, Adorable $7,000 Car Turning Japan Onto EVs
The single seat Mibot charges from a regular plug as quickly as an iPad, and is about half the price of an average EV.

With Protected Lanes, 460% More People Commute by Bike
For those needing more ammo, more data proving what we already knew is here.

In More Metros Than You’d Think, Suburbs are Now More Expensive Than the City
If you're moving to the burbs to save on square footage, data shows you should think again.

The States Losing Rural Delivery Rooms at an Alarming Pace
In some states, as few as 9% of rural hospitals still deliver babies. As a result, rising pre-term births, no adequate pre-term care and "harrowing" close calls are a growing reality.
Urban Design for Planners 1: Software Tools
This six-course series explores essential urban design concepts using open source software and equips planners with the tools they need to participate fully in the urban design process.
Planning for Universal Design
Learn the tools for implementing Universal Design in planning regulations.
Smith Gee Studio
City of Charlotte
City of Camden Redevelopment Agency
City of Astoria
Transportation Research & Education Center (TREC) at Portland State University
US High Speed Rail Association
City of Camden Redevelopment Agency
Municipality of Princeton (NJ)