


A new report released by the New York City Department of Transportation (DOT) shows a steady increase in the number of bikers in the city. A lack of data, however, continues to be a problem for accurate assessment of the trend.
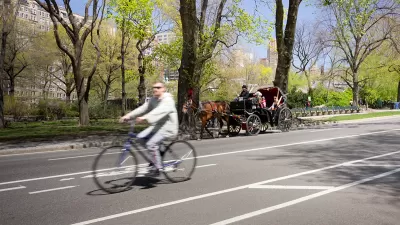
"Biking in New York City has been rising at a steady clip, according to a new report from NYC DOT, increasing about 50 percent between 2010 and 2014," reports Ben Fried.
Tempering Fried's excitement about the growing number of bikers in the city are the glaring omissions in the report: "What’s not so clear is how things changed in 2015, because the report lacks key information about bike traffic on the Hudson River Greenway."
The "Cycling in the City" report [pdf] combines data from the U.S. Census, a city Department of Health survey, and the DOT bike counts. "In some ways the report is a step up from the annual cycling metrics DOT has released in the past, which only included the DOT bike counts," writes Fried. "Folding in the Census bike commute numbers and health department survey data yields a more complete view of citywide and borough-by-borough cycling trends."
The problem begins in 2015, explains Fried. Because the report lacks "counts of cyclists on the Hudson River Greenway and 50th Street, or at the Whitehall ferry terminal" in 2015, it's impossible to compare that year to the years previous. Friend offers this recommendation: "Instead of waiting for DOT to release a report with all of these stats each year, the city should be publishing them as feeds on its open data portal, giving New Yorkers access to all the underlying numbers."
The article also includes a series of information-packed graphics to illustrate the trends in biking around the city.
FULL STORY: All of DOT’s Bike Metrics Should Be Published on NYC’s Open Data Portal

Op-Ed: NYC Making Progress on Bike Network Access, Should Do More
2019 was the first year in which New York City's Department of Transportation kept affected bike lanes open during the UN's General Assembly. That should be a sign of things to come, advocates argue.

Fewer New Yorkers Riding Bikes
A recent report presents evidence that fewer New Yorkers are choosing bikes as an alternative form of transportation.
Report: NYC Not Doing Enough to Prioritize Buses
According to a bus advocacy coalition's progress report, New York City hasn't yet delivered on promises to get buses moving faster with comprehensive and well-enforced bus lanes.

Planetizen Federal Action Tracker
A weekly monitor of how Trump’s orders and actions are impacting planners and planning in America.

Restaurant Patios Were a Pandemic Win — Why Were They so Hard to Keep?
Social distancing requirements and changes in travel patterns prompted cities to pilot new uses for street and sidewalk space. Then it got complicated.

Maui's Vacation Rental Debate Turns Ugly
Verbal attacks, misinformation campaigns and fistfights plague a high-stakes debate to convert thousands of vacation rentals into long-term housing.

In California Battle of Housing vs. Environment, Housing Just Won
A new state law significantly limits the power of CEQA, an environmental review law that served as a powerful tool for blocking new development.

Boulder Eliminates Parking Minimums Citywide
Officials estimate the cost of building a single underground parking space at up to $100,000.

Orange County, Florida Adopts Largest US “Sprawl Repair” Code
The ‘Orange Code’ seeks to rectify decades of sprawl-inducing, car-oriented development.
Urban Design for Planners 1: Software Tools
This six-course series explores essential urban design concepts using open source software and equips planners with the tools they need to participate fully in the urban design process.
Planning for Universal Design
Learn the tools for implementing Universal Design in planning regulations.
Heyer Gruel & Associates PA
JM Goldson LLC
Custer County Colorado
City of Camden Redevelopment Agency
City of Astoria
Transportation Research & Education Center (TREC) at Portland State University
Camden Redevelopment Agency
City of Claremont
Municipality of Princeton (NJ)