


MIT's You Are Here mapping and data visualization project has produced a map of income levels, as tracked by the routes of the Metro subway system in Washington D.C.
Ana Swanson shares news of a new mapping project by MIT's You Are Here that uses the subway system of Washington D.C. to map to create a visualization of median household incomes. "The graphic draws on census data on earnings within a radius of half a mile around subway stations. It graphs both the median household income for each stop and the overall average for the line," according to Swanson.
After breaking down the details of each station's income levels, Swanson provides the following analysis: "Looking at the graphs [of individual lines], you can see that these higher average incomes result because of a sharp discrepancy in income between Washington’s eastern and western halves."
The original You Are Here post explains that the project was inspired by the "Inequality and New York's Subway" feature by The New Yorker.
Swanson reports that You Are Here is reaching into new territory with the project: "This is the first project from You Are Here’s new open-source library, which allows census data for any city to be visualized over a transit network."
FULL STORY: How median income varies by subway line in Washington, D.C.

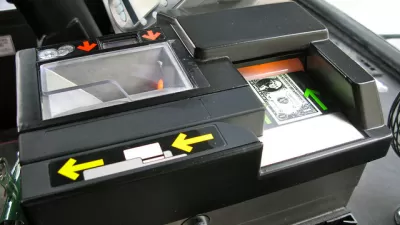
Cash-Free Transit: Convenient or Unjust?
Washington, D.C.'s Metro is trying a cashless bus pilot that will last until December.

L.A. Metro CEO Challenges Trump on Infrastructure Funding
President Trump’s most recent transportation budget is projected to cut transportation spending by 13 percent, potentially undercutting many of Los Angeles' ambitious projects to continue the build-out of a full public transportation system.
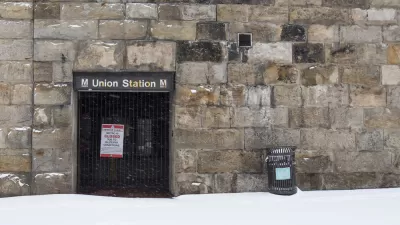
D.C. Metro Approves Fare Hike, Service Cuts
For months, transit advocates have dreaded the decision to raise fares and cut service throughout the D.C. Metro system. That day arrived last week. Changes take effect on July 1.

Montreal Mall to Become 6,000 Housing Units
Place Versailles will be transformed into a mixed-use complex over the next 25 years.

Planetizen Federal Action Tracker
A weekly monitor of how Trump’s orders and actions are impacting planners and planning in America.

DARTSpace Platform Streamlines Dallas TOD Application Process
The Dallas transit agency hopes a shorter permitting timeline will boost transit-oriented development around rail stations.

Without International Immigrants, the Rural US Population Would Be Falling 58%
Census data shows that population growth in rural areas is due in large part to international migrants.

Dead End: Nine Highways Ready for Retirement
The Freeways Without Futures report describes the nation’s most promising highway removal proposals.

Congressman Proposes Bill to Rename DC Metro “Trump Train”
The Make Autorail Great Again Act would withhold federal funding to the system until the Washington Metropolitan Area Transit Authority (WMATA), rebrands as the Washington Metropolitan Authority for Greater Access (WMAGA).
Urban Design for Planners 1: Software Tools
This six-course series explores essential urban design concepts using open source software and equips planners with the tools they need to participate fully in the urban design process.
Planning for Universal Design
Learn the tools for implementing Universal Design in planning regulations.
City of Mt Shasta
City of Camden Redevelopment Agency
City of Astoria
Transportation Research & Education Center (TREC) at Portland State University
City of Camden Redevelopment Agency
Municipality of Princeton (NJ)
Regional Transportation Commission of Southern Nevada