


Neighborhood level unemployment data estimates reveal the deepening social inequality of the current economic crisis.
Quoctrung Bui and Emily Badger sum up the state of the economy amidst the coronavirus pandemic in the summer of 2020:
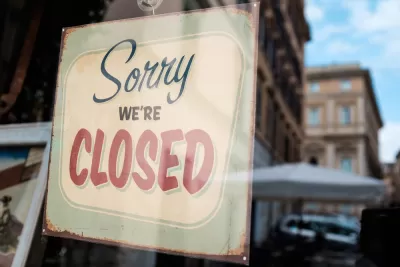
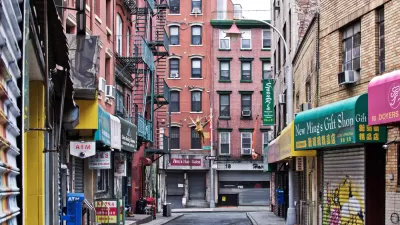
The economic damage from the coronavirus is most visible in areas like Midtown Manhattan, where lunch spots have closed, businesses have gone dark and once-crowded sidewalks have emptied.
But some of the worst economic pain lies in other neighborhoods, in the places where workers who’ve endured the broadest job losses live. In corners of the Bronx, South Los Angeles or the South Side of Chicago, unemployment is concentrated to a breathtaking degree. And that means that other problems still to come — a wave of evictions, deepening poverty, more childhood hunger — will be geographically concentrated, too.
The article by Bui and Badger shares research estimating unemployment data down to the Census tract level by Yair Ghitza and Mark Steitz. "The federal government doesn’t report unemployment data down to the neighborhood level, so the two researchers modeled these fine-grained statistics in a way that makes them consistent with state and national surveys," explain Bui and Badger.
A working paper presenting the data is available on GitHub.
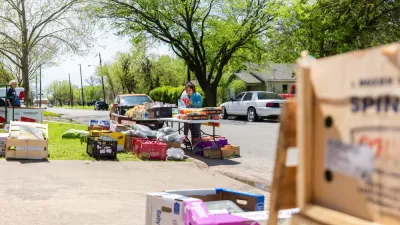
Deep economic disparities within cities are the main takeaway from the research findings, and the most outwardly visible signs of the economic downturn—the shuttered restaurants and retail businesses—aren't evidence of the worst of the economic situation. "These maps reflect, instead, where the workers who once staffed those restaurants, bars, hotels and offices commuted home at night," according to Bui and Badger.
The current findings, nearly five months into the pandemic in the United States, echo findings from much earlier in the pandemic in April, presented by Jonathan Stiles as well as researchers from the Urban Institute.
FULL STORY: In These Neighborhoods, the Jobless Rate May Top 30 Percent


Surveying the Fiscal Nightmare for Cities and States
Governing takes a tour through the fiscal impacts of a suddenly cratered economy and an ongoing public health crisis.
The Geography of Low-Income Job Losses
The historic job losses of the past two months have hit the most vulnerable workers harder than others, so far. The Urban Institute estimated and mapped where more low-income jobs have been lost.
More Support Needed for Organizations Serving the Underserved
A new report details how policymakers and community leaders can improve California's efforts to advance an equitable recovery from COVID by supporting and empowering community-based organizations in underserved communities.

Planetizen Federal Action Tracker
A weekly monitor of how Trump’s orders and actions are impacting planners and planning in America.

Congressman Proposes Bill to Rename DC Metro “Trump Train”
The Make Autorail Great Again Act would withhold federal funding to the system until the Washington Metropolitan Area Transit Authority (WMATA), rebrands as the Washington Metropolitan Authority for Greater Access (WMAGA).

The Simple Legislative Tool Transforming Vacant Downtowns
In California, Michigan and Georgia, an easy win is bringing dollars — and delight — back to city centers.

The States Losing Rural Delivery Rooms at an Alarming Pace
In some states, as few as 9% of rural hospitals still deliver babies. As a result, rising pre-term births, no adequate pre-term care and harrowing close calls are a growing reality.

The Small South Asian Republic Going all in on EVs
Thanks to one simple policy change less than five years ago, 65% of new cars in this Himalayan country are now electric.

DC Backpedals on Bike Lane Protection, Swaps Barriers for Paint
Citing aesthetic concerns, the city is removing the concrete barriers and flexposts that once separated Arizona Avenue cyclists from motor vehicles.
Urban Design for Planners 1: Software Tools
This six-course series explores essential urban design concepts using open source software and equips planners with the tools they need to participate fully in the urban design process.
Planning for Universal Design
Learn the tools for implementing Universal Design in planning regulations.
Smith Gee Studio
City of Charlotte
City of Camden Redevelopment Agency
City of Astoria
Transportation Research & Education Center (TREC) at Portland State University
US High Speed Rail Association
City of Camden Redevelopment Agency
Municipality of Princeton (NJ)