


This performance ranking separates the fakers from the legit operation to reduce carbon emissions from transportation.
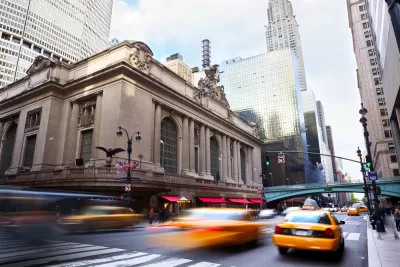
Streetlight Data released its "2020 U.S. Transportation Climate Impact Index," which ranks the 100 largest metropolitan areas on climate impact using performance-based transportation metrics.
As explained in an article that introduces the index, the rankings boil down to the difference between car travel and low-carbon alternative modes of travel. Thus, the number one metropolitan area probably won't come as a surprise: New York City-Newark-Jersey City. Coming in second is San Francisco-Oakland-Hayward, and coming in third is Madison, Wisconsin.
Streetlight Data released a package of data and articles to help offer insight into the details of the index beyond the rankings. So the entire list of metropolitan areas and rankings by key metrics in the index are also available.
The decline of the coal industry in recent years has pushed transportation to the top of the list as the largest emitter of greenhouse gas by sector. Streetlight Data puts a finer point on the origins of that leading source of greenhouse gases.
FULL STORY: 2020 U.S. Transportation Climate Impact Index

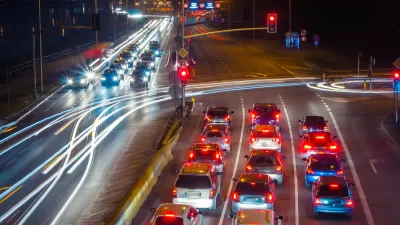
Where the Pandemic Has Scrambled Traffic Patterns
The map of metropolitan areas that drive least, and thus emit fewer greenhouse gas emissions, has been completely redrawn by the pandemic, according to a recent report.
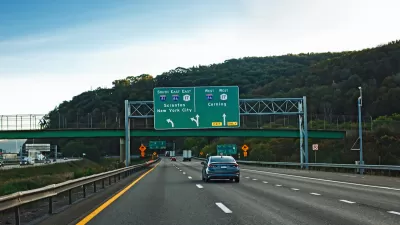
Proposed New York Bill Would Align Transportation Projects With Driving Reduction Goals
If passed, the law would require all highway projects to show how they would reduce VMT or mitigate their impact.
Connecting Land Use and Transportation Planning to Save the Climate
The United States will have to make major changes to long-standing land use and transportation paradigms to prevent the worst outcomes of climate change. How to make those changes was the subject of a recent podcast.

Planetizen Federal Action Tracker
A weekly monitor of how Trump’s orders and actions are impacting planners and planning in America.
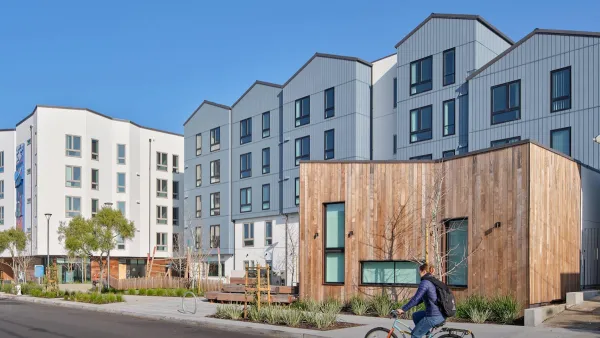
San Francisco's School District Spent $105M To Build Affordable Housing for Teachers — And That's Just the Beginning
SFUSD joins a growing list of school districts using their land holdings to address housing affordability challenges faced by their own employees.
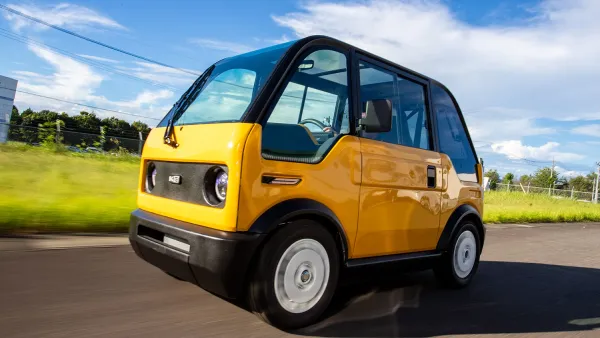
The Tiny, Adorable $7,000 Car Turning Japan Onto EVs
The single seat Mibot charges from a regular plug as quickly as an iPad, and is about half the price of an average EV.

With Protected Lanes, 460% More People Commute by Bike
For those needing more ammo, more data proving what we already knew is here.

In More Metros Than You’d Think, Suburbs are Now More Expensive Than the City
If you're moving to the burbs to save on square footage, data shows you should think again.

The States Losing Rural Delivery Rooms at an Alarming Pace
In some states, as few as 9% of rural hospitals still deliver babies. As a result, rising pre-term births, no adequate pre-term care and "harrowing" close calls are a growing reality.
Urban Design for Planners 1: Software Tools
This six-course series explores essential urban design concepts using open source software and equips planners with the tools they need to participate fully in the urban design process.
Planning for Universal Design
Learn the tools for implementing Universal Design in planning regulations.
Smith Gee Studio
City of Charlotte
City of Camden Redevelopment Agency
City of Astoria
Transportation Research & Education Center (TREC) at Portland State University
US High Speed Rail Association
City of Camden Redevelopment Agency
Municipality of Princeton (NJ)