


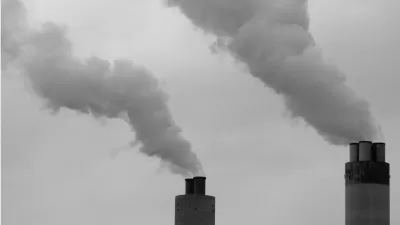
The sobering news comes from the Rhodium Group, a research firm that tracks CO2 emissions. The preliminary estimate is the third in two months to show an increase in 2018, attributing it to an improved economy and Trump's regulation rollbacks.
"The findings, published Tuesday by the independent economic research firm Rhodium Group, mean that the United States now has a diminishing chance of meeting its pledge under the 2015 Paris climate agreement to dramatically reduce its emissions by 2025," report Chris Mooney Brady Dennis for The Washington Post.
While President Trump initiated the withdrawal from the global agreement on June 1, 2017, the only nation to do so, the U.S. remains officially in it until November 2020, four years after the agreement took effect.
“We have lost momentum. There’s no question,” Rob Jackson, a Stanford University professor who studies emissions trends, said of both U.S. and global efforts to steer the world toward a more sustainable future.
The sharp emissions rise was fueled primarily by a booming economy, researchers found. But the increase, which could prove to be the second-largest in the past 20 years, probably would not have been as stark without Trump administration rollbacks, said Trevor Houser, a partner at Rhodium.
“The big takeaway for me is that we haven’t yet successfully decoupled U.S. emissions growth from economic growth,” Houser told Brad Plumer of The New York Times.
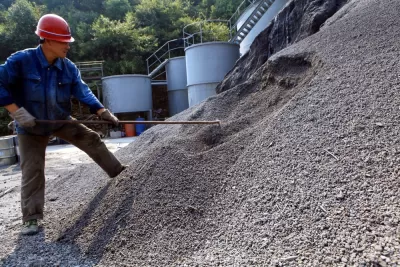
As United States manufacturing boomed, for instance, emissions from the nation’s industrial sectors — including steel, cement, chemicals and refineries — increased by 5.7 percent.
Houser told NPR (audio available) that based on preliminary data, emissions in the U.S. grew by the highest rate since 2010. "The big drivers were increased electricity demand and growth in trucking and aviation," reports Geoff Brumfiel.
Surprisingly, emissions from passenger vehicles decreased ever so slightly, "highlight(ing) the challenges in decarbonizing the transportation sector beyond light-duty vehicles," according to the report:
The transportation sector retained its title as the largest source of CO2 emissions in the US for the third year running (Figure 4).
During the first nine months of the year, gasoline demand declined by 0.1% as modest efficiency gains offset a minor increase in vehicle miles traveled (Figure 5). But robust growth in demand for both trucking and air travel increased demand for diesel and jet fuel by 3.1% and 3.0%, respectively.
"The Rhodium report is not the first clue that 2018 was basically a terrible year for the climate," writes Robinson Meyer for The Atlantic.
Last month, two studies and also found that worldwide carbon emissions surged in 2018. This change is a discouraging sign, since global emissions stagnated through the middle of the decade.
Meyer refers to reports prepared by the Global Carbon Budget and a team led by Stanford Professor Rob Jackson.
Related in Planetizen:
-
Major Increase in Global Carbon Emissions Projected for 2018, December 7, 2018The report from the Global Carbon Project, an international group of scientists who track greenhouse gas emissions, comes as a surprise as emissions had been relatively flat for the last four years. Global emissions this year will increase 2.7%.
-
Greenhouse Gas Emissions Continue to Decrease in the U.S., October 23, 2018President Trump and his cabinet have been busy rolling back environmental regulations and promoting coal burning, and now they claim credit for a reduction in greenhouse gas emissions last year even greater than in 2016.
FULL STORY: U.S. greenhouse gas emissions spiked in 2018 — and it couldn’t happen at a worse time

No Good News for Climate Stabilization From a New Worldwide Energy Report
Last month, the Paris-based International Energy Agency released its annual "Global Energy & CO2 Status Report." Energy consumption grew 2.3 percent with fossil fuels accounting for 70 percent on the increase. CO2 emissions jumped 1.7 percent.
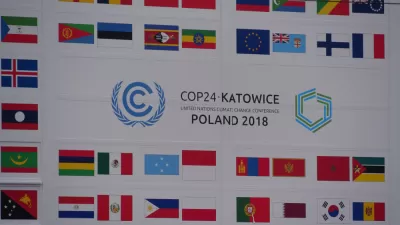
Implementing the Paris Climate Agreement in Katowice, Poland
Representatives from nearly 200 nations have been attending the U.N. Climate Change Conference in Katowice since Dec. 2 to work on implementing the 2015 Paris climate agreement. Scheduled to end Friday, it will be extended two days due to discord.
Major Increase in Global Carbon Emissions Projected for 2018
The report from the Global Carbon Project, an international group of scientists who track greenhouse gas emissions, comes as a surprise as emissions had been relatively flat for the last four years. Global emissions this year will increase 2.7%.

Montreal Mall to Become 6,000 Housing Units
Place Versailles will be transformed into a mixed-use complex over the next 25 years.

Planetizen Federal Action Tracker
A weekly monitor of how Trump’s orders and actions are impacting planners and planning in America.

DARTSpace Platform Streamlines Dallas TOD Application Process
The Dallas transit agency hopes a shorter permitting timeline will boost transit-oriented development around rail stations.

Interactive Map Reveals America's “Shade Deserts”
Launched by UCLA and American Forests to combat heat-related deaths, the tool maps the shade infrastructure for over 360 U.S. cities.

Bicycles and Books — In Sacramento, Libraries Now Offer Both
Adult library card holders can check out e-bikes and e-trikes for up to one week.

Colorado Landfills Emit as Much Pollution as 1M Cars
Landfills are the third-largest source of methane pollution in Colorado, after agriculture and fossil fuel extraction.
Urban Design for Planners 1: Software Tools
This six-course series explores essential urban design concepts using open source software and equips planners with the tools they need to participate fully in the urban design process.
Planning for Universal Design
Learn the tools for implementing Universal Design in planning regulations.
City of Mt Shasta
City of Camden Redevelopment Agency
City of Astoria
Transportation Research & Education Center (TREC) at Portland State University
US High Speed Rail Association
City of Camden Redevelopment Agency
Municipality of Princeton (NJ)