


Launched by UCLA and American Forests to combat heat-related deaths, the tool maps the shade infrastructure for over 360 U.S. cities.

A new tool from the UCLA Luskin Center for Innovation and American Forests maps shade in 101 of the nation’s largest urbanized areas, visualizing how shade provided by trees and buildings shifts throughout the day.
The tool is designed to help policymakers understand gaps in their city’s tree canopy and which areas are in the biggest need of additional resources. “The map reveals widespread “shade deserts” — areas lacking adequate shade infrastructure — throughout virtually all major urban regions in the U.S.”
“By showing shade at noon, 3 p.m. and 6 p.m. — including parcel-level data in select cities — the Shade Map allows civic leaders to identify where investments in natural and engineered shade are most needed.” For example, the map reveals that trees are a “particularly powerful” shade solution because they provide 25 times more shade at noon than buildings do.
FULL STORY: National shade map from UCLA and American Forests launched to combat deadly urban heat


Planting for Change: How Trees Are Powering Climate Action
"Combating Climate Change with Trees" highlights how Southern California communities are strategically planting and nurturing urban forests to cool neighborhoods, improve air quality, and advance environmental justice.

Art in the Shade: Confronting Climate and Equity Through Creativity
Through powerful, multisensory installations, Roots of Cool uses art to illuminate Los Angeles’ climate and shade inequities, inviting visitors to imagine a more just, tree-filled future.

Index Measures Impact of Heat on Pedestrian Activity
When heat and humidity are high, people are more likely to opt for cars when possible.

Planetizen Federal Action Tracker
A weekly monitor of how Trump’s orders and actions are impacting planners and planning in America.
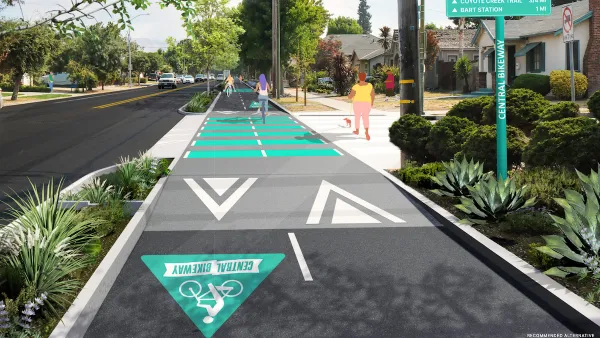
Silicon Valley ‘Bike Superhighway’ Awarded $14M State Grant
A Caltrans grant brings the 10-mile Central Bikeway project connecting Santa Clara and East San Jose closer to fruition.

Amtrak Cutting Jobs, Funding to High-Speed Rail
The agency plans to cut 10 percent of its workforce and has confirmed it will not fund new high-speed rail projects.

Planting for Change: How Trees Are Powering Climate Action
"Combating Climate Change with Trees" highlights how Southern California communities are strategically planting and nurturing urban forests to cool neighborhoods, improve air quality, and advance environmental justice.

Could Planners Adopt a 'Place Sherpa' Role?
Building upon the framework of a local housing panel, Chuck Wolfe suggests that advocacy and policy discussions would be enhanced by a “sherpa mindset” that focuses on lived experiences, facilitates applied knowledge of urban places, and promotes stakeholder discussion.

California Advances Its 30x30 Conservation Goals
California is making significant progress toward its 30x30 conservation goals, but looming federal rollbacks and gaps in biodiversity protections could threaten the state’s efforts to protect lands and coastal waters by 2030.
Urban Design for Planners 1: Software Tools
This six-course series explores essential urban design concepts using open source software and equips planners with the tools they need to participate fully in the urban design process.
Planning for Universal Design
Learn the tools for implementing Universal Design in planning regulations.
Caltrans
City of Fort Worth
Mpact (founded as Rail~Volution)
City of Camden Redevelopment Agency
City of Astoria
City of Portland
City of Laramie