


The New York Times illustrates the scope and scale of the great project still facing the United States: to decrease greenhouse gas emissions from the transportation sector of its economy.
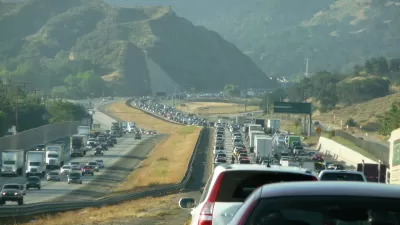
"Transportation is the largest source of planet-warming greenhouse gases in the United States today and the bulk of those emissions come from driving in our cities and suburbs."
So reads the introduction to an interactive map published by The New York Times, claiming to be the most detailed map of auto emissions in the United States, using data from Boston University's Database of Road Transportation Emissions.
"Even as the United States has reduced carbon dioxide emissions from its electric grid, largely by switching from coal power to less-polluting natural gas, emissions from transportation have remained stubbornly high," write Nadja Popovich and Denise Lu in the article that runs alongside the interactive map.
"The bulk of those emissions, nearly 60 percent, come from the country’s 250 million passenger cars, S.U.V.s and pickup trucks, according to the Environmental Protection Agency. Freight trucks contribute an additional 23 percent."
The article discusses the state of environmental regulation as the transition between the Obama and Trump administrations begins to have consequential outcomes for the nation's environmental policies. The article also teases out some of the geographic distinctions illustrated by the map:
Boston University’s emissions database, first published in 2015 and updated this week with an additional five years of data, reveals that much of the increase in driving-related CO2 has occurred in and around cities.
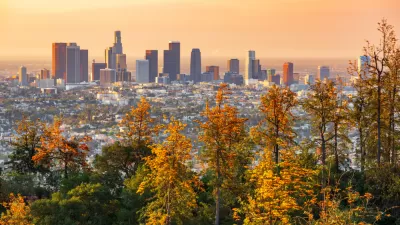
New York City and Los Angeles lead the country in terms of the total number of emissions—in line with those cities' positions as the two most populous in the country. Emissions in both cities, however, have grown significantly since 1990.
The map isn't the only interactive graphic included in the article, and Los Angeles and New York City are far from the only cities with growing emissions, measured both by total and per capita.
FULL STORY: The Most Detailed Map of

LA’s Trees Absorb More Carbon Than Expected, But Can’t Do It Alone
A USC study finds that Los Angeles’ urban trees absorb more carbon than expected, but while they provide crucial environmental benefits, they cannot replace the urgent need for systemic emissions reductions.
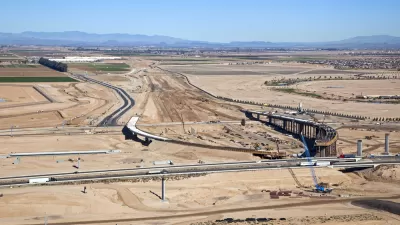
Infrastructure Funding Could Lead to Higher Carbon Emissions
Billions in federal infrastructure funding slated to go to states with few strings attached could fund roadway construction and widening projects that will raise greenhouse gas emissions and worsen climate change.

Assessing Prince George's County's Climate Action Plan
The Prince George's County draft Climate Action Plan includes ambitious goals and timetables, but falls short of recommended targets for emissions reductions in the transportation sector.

Planetizen Federal Action Tracker
A weekly monitor of how Trump’s orders and actions are impacting planners and planning in America.

Map: Where Senate Republicans Want to Sell Your Public Lands
For public land advocates, the Senate Republicans’ proposal to sell millions of acres of public land in the West is “the biggest fight of their careers.”

Restaurant Patios Were a Pandemic Win — Why Were They so Hard to Keep?
Social distancing requirements and changes in travel patterns prompted cities to pilot new uses for street and sidewalk space. Then it got complicated.

Platform Pilsner: Vancouver Transit Agency Releases... a Beer?
TransLink will receive a portion of every sale of the four-pack.

Toronto Weighs Cheaper Transit, Parking Hikes for Major Events
Special event rates would take effect during large festivals, sports games and concerts to ‘discourage driving, manage congestion and free up space for transit.”

Berlin to Consider Car-Free Zone Larger Than Manhattan
The area bound by the 22-mile Ringbahn would still allow 12 uses of a private automobile per year per person, and several other exemptions.
Urban Design for Planners 1: Software Tools
This six-course series explores essential urban design concepts using open source software and equips planners with the tools they need to participate fully in the urban design process.
Planning for Universal Design
Learn the tools for implementing Universal Design in planning regulations.
Heyer Gruel & Associates PA
JM Goldson LLC
Custer County Colorado
City of Camden Redevelopment Agency
City of Astoria
Transportation Research & Education Center (TREC) at Portland State University
Camden Redevelopment Agency
City of Claremont
Municipality of Princeton (NJ)