


To be equitable and efficient, transportation planning must apply a sustainable transportation hierarchy that prioritizes affordable, healthy, and resource-efficient mobility options.


Many common planning practices are biased in ways that favor faster travel—and therefore automobile travel—over slower but more affordable, inclusive, healthy, and resource-efficient modes. For example, conventional indicators, such as roadway level-of-service (LOS) and hours of congestion delay evaluate performance based on traffic speeds and give little priority to other goals. In addition, roads and parking facilities have dedicated funding while sidewalks, bikeways, and public transit services must compete for funds with other public expenditures. As a result, most communities underinvest in non-auto modes. This creates automobile-dependent communities where it is difficult to get around without a car.
There are ways to correct these biases to create more equitable and efficient transport systems. Some jurisdictions have vehicle travel reduction targets, and policies to achieve them. For example, British Columbia, where I live, has targets to reduce light-duty vehicle travel by 25 percent and double non-auto trips by 2030. California has targets to reduce per capita light-duty VMT by 25 percent by 2030 and 30 percent by 2045, and requires planning decisions to be consistent with those targets. Colorado has similar rules. Minnesota has a target to reduce vehicle travel by 14 percent by 2040 and 20 percent by 2050.
Another approach is to apply a sustainable transportation hierarchy, which gives priority to affordable, inclusive, and resource-efficient modes. The image below illustrates this concept.
Sustainable Transportation Hierarchy
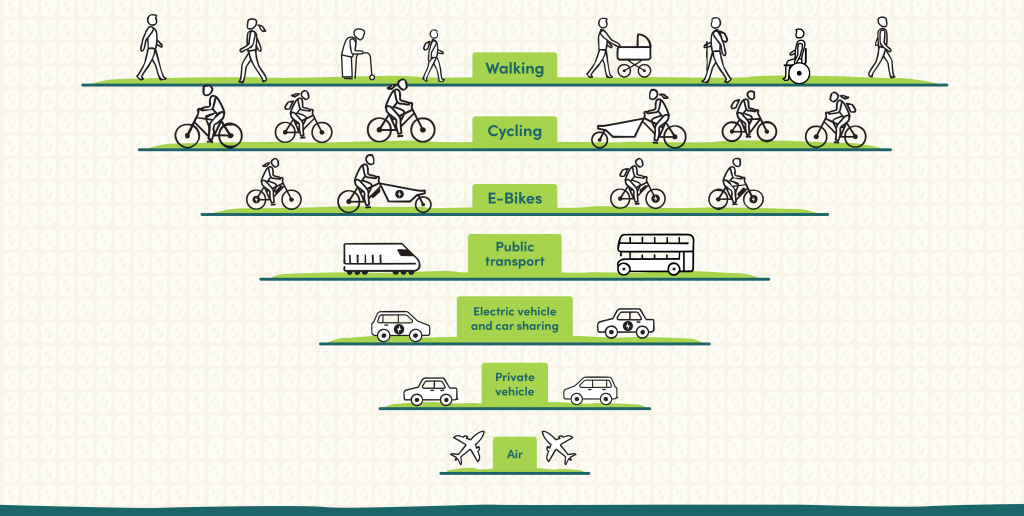
There are many variations of this illustration. The image below by the Institute for Sensible Transport shows why these priorities are justified: walking, bicycling, and public transport require less space and create less pollution than automobile travel. This could be expanded to include other factors such as user costs, road and parking infrastructure costs, crash risks imposed on other people, and health impacts.
Sustainable transportation hierarchy
A sustainable transportation hierarchy can be applied to various types of planning decisions.
Funding allocation
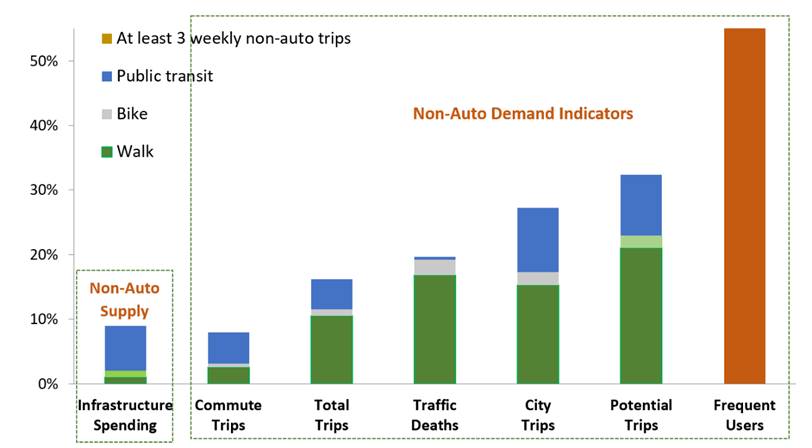
Sustainable transport planning spends less on roadway expansions and parking subsidies and more on walking, bicycling, and public transport improvements. This is a major change. Currently, less than 10 percent of transportation infrastructure funding is spent on sustainable modes, which is less than their portion of total trips, crashes, users, and potential trips, as illustrated below.
Non-auto infrastructure spending versus demand indicators
Roadway design
A sustainable transportation hierarchy can also be applied to roadway design and road space allocation. This is consistent with Complete Streets policies that prioritize the safety and mobility of all users instead of the speed of cars and flow of traffic.
Let me illustrate. I recently visited Hong Kong, one of the world’s densest and most multimodal cities. Only a small portion of total trips in that city are by car, particularly in central neighborhoods such as Kowloon and Wan Chai where we stayed. Yet, the majority of road right-of-way was devoted to vehicle traffic and parking. As a result, the sidewalks were crowded and uncomfortable, and crossing streets was slow and sometimes dangerous, as illustrated below. There are few bikeways and bicycling is difficult, so bicycling is much less common than would be optimal.
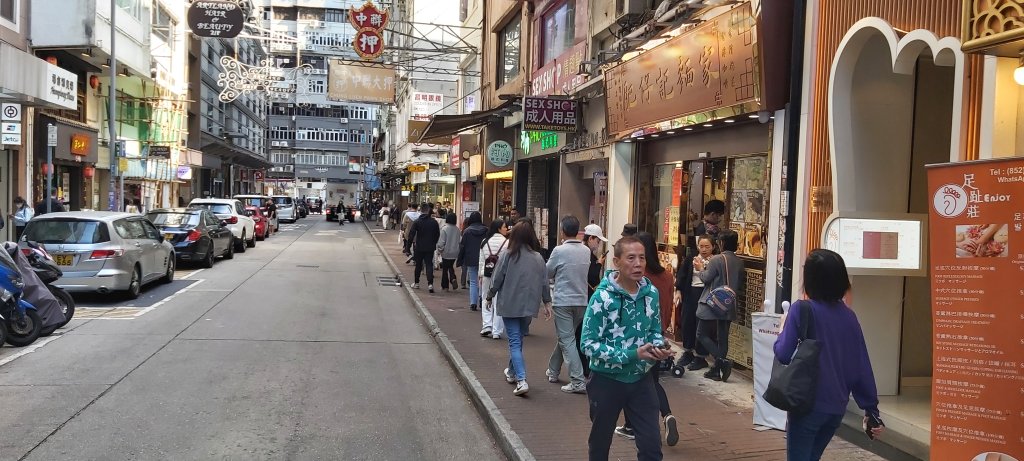
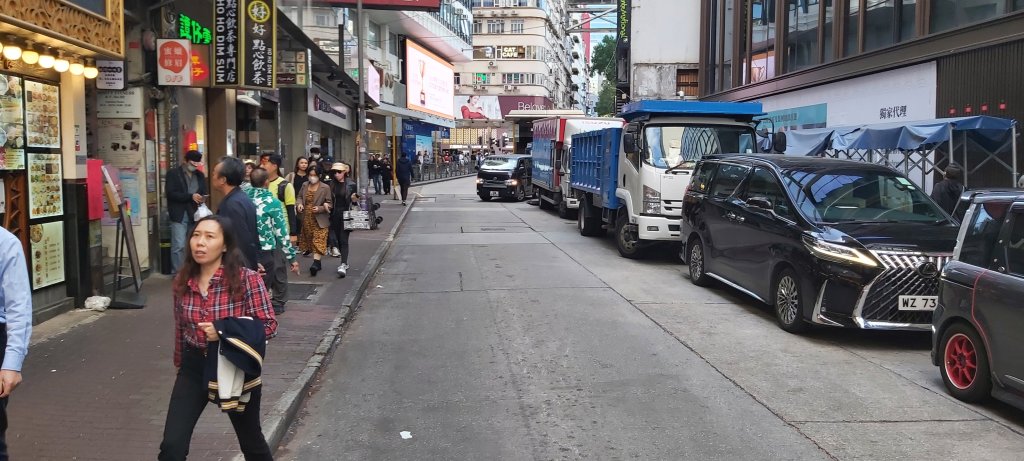
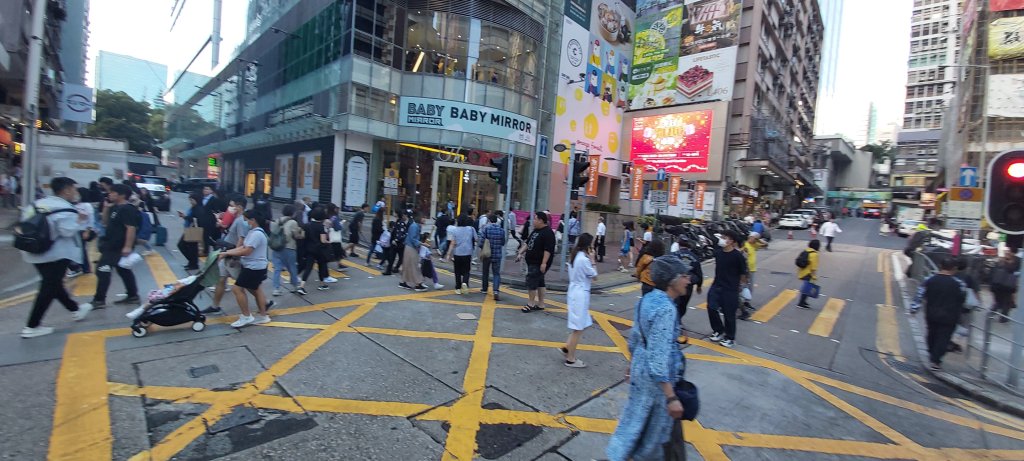
Unfortunately, Hong Kong is not unique; most city streets are designed to favor motor vehicle travel to the detriment of walking and bicycling. A sustainable transportation hierarchy devotes more road space to walking and bicycling, including wider sidewalks, better crosswalks, and plenty of bikeways.
Land development patterns
A sustainable transportation hierarchy can also be applied to land use development patterns. It favors Smart Growth development policies that create more compact, mixed, and transit-oriented communities, so travel distances are shorter and more destinations are accessible by sustainable modes.
A sustainable transportation hierarchy also reforms parking policies so non-drivers are no longer forced to pay for costly parking spaces they don't need. This reduces the number of parking spaces needed to serve motorists’ demands, freeing up urban space and funding for sustainable infrastructure.
Traffic speed and management
A sustainable transportation hierarchy can also apply to traffic speed and management decisions. For example, walking and bicycling require low speeds for safety and comfort. Micromodes (e-bikes and e-scooters) can travel a little faster, and urban buses can operate somewhat faster. Motorists expect higher speeds and transportation planners traditionally design streets and roads to accommodate them, although that is dangerous and uncomfortable for sustainable modes. For sustainability, slower is better!
Optimal facility design speed by mode
Optimal Design Speeds |
Miles per Hour (Kms per Hour) |
|
Active modes (walking and bicycling) |
3-12 (5-20) |
|
Micromodes (e-bikes and e-scooters) |
10-15 (15-25) |
|
Urban bus |
20-30 (30-50) |
|
Automobiles |
40+ (65+) |
A sustainable transportation hierarchy favors lower roadway design speeds to make walking, bicycling and public transit safer and more comfortable.
Current demographic and economic trends are causing automobile travel to peak and increasing demand for non-auto travel. A sustainable transportation hierarchy responds to those changes by favoring affordable, inclusive, and resource-efficient modes. This benefits everybody, including motorists who experience less traffic and parking congestion, increased safety, and reduced chauffeuring burdens.
To optimize transportation, planners should prioritize affordability, social equity, inclusivity, health, safety, livability, and environmental quality with a sustainable transportation hierarchy.

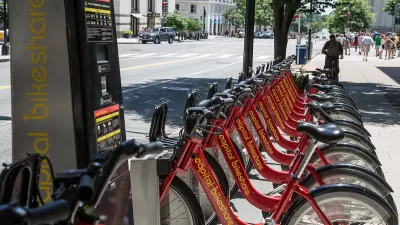
DC Micromobility Use Keeps Growing
Capital Bikeshare saw its fourth straight month of record ridership.

Meet NYC’s New Office of Livable Streets
The NYC DOT program will build on pandemic-era initiatives to promote safe and comfortable streets that enhance community and expand uses beyond just moving cars.

L.A. Times: California Must Shift Transportation Spending Priorities
Despite its ambitious emissions reduction goals, California continues to spend a majority of transportation funds on car-centric infrastructure.

Maui's Vacation Rental Debate Turns Ugly
Verbal attacks, misinformation campaigns and fistfights plague a high-stakes debate to convert thousands of vacation rentals into long-term housing.

Planetizen Federal Action Tracker
A weekly monitor of how Trump’s orders and actions are impacting planners and planning in America.

In Urban Planning, AI Prompting Could be the New Design Thinking
Creativity has long been key to great urban design. What if we see AI as our new creative partner?

King County Supportive Housing Program Offers Hope for Unhoused Residents
The county is taking a ‘Housing First’ approach that prioritizes getting people into housing, then offering wraparound supportive services.

Researchers Use AI to Get Clearer Picture of US Housing
Analysts are using artificial intelligence to supercharge their research by allowing them to comb through data faster. Though these AI tools can be error prone, they save time and housing researchers are optimistic about the future.

Making Shared Micromobility More Inclusive
Cities and shared mobility system operators can do more to include people with disabilities in planning and operations, per a new report.
Urban Design for Planners 1: Software Tools
This six-course series explores essential urban design concepts using open source software and equips planners with the tools they need to participate fully in the urban design process.
Planning for Universal Design
Learn the tools for implementing Universal Design in planning regulations.
planning NEXT
Appalachian Highlands Housing Partners
Mpact (founded as Rail~Volution)
City of Camden Redevelopment Agency
City of Astoria
City of Portland
City of Laramie