


Travel demands are changing and so should planning. There are good reasons for communities to spend less on automobile facilities and more on walking, bicycling, and public transit. Let’s examine why.

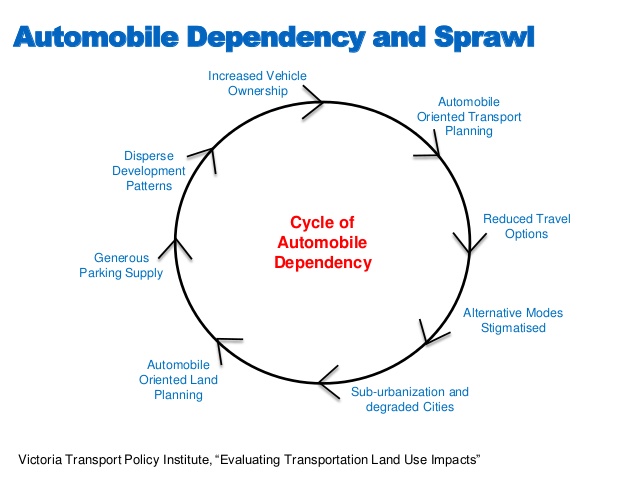
During the automobile ascendency of the twentieth century, motor vehicle travel grew from almost zero to become the dominant mode in most American communities. During that time, it made sense to invest significant resources in building roads. However, the resulting planning practices created a self-reinforcing cycle of automobile dependency and sprawl, as illustrated below.
Automobiles receive the vast majority of transportation funding: about 85 percent of spending by departments of transportation is devoted to roadways—about 95 percent if we also consider expenditures by businesses on government-mandated parking facilities.
Estimated Infrastructure Spending
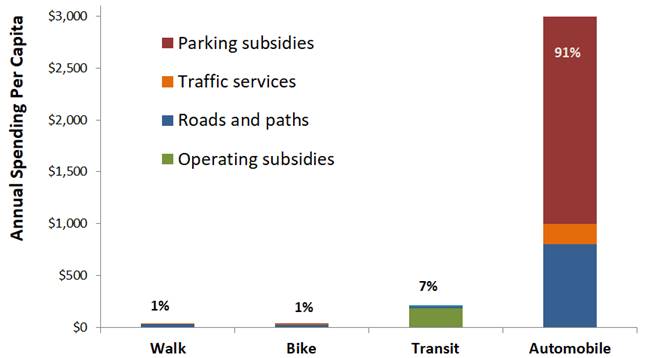
This graph compares infrastructure investments for various modes. Automobiles currently receive far more investments than other modes.
This made driving easier and other forms of travel worse. As a result, most North American communities are automobile dependent: it is easy to get around by car but difficult to access common services and activities without driving, and residents bear the additional costs of providing road and parking infrastructure, dealing with traffic problems, and chauffeuring non-drivers.
Despite all this spending, per capita automobile travel has peaked in most developed countries, and there is increasing demand for alternatives, both by individuals who want to spend less time and money driving, and by communities that want to reduce traffic problems. This is a good time to implement more multimodal planning.
There are three general factors to consider when determining how much to invest in different modes: economic efficiency, consumer demands, and social equity. Let’s examine them.
1. Economic Efficiency
Economic efficiency strives to maximize the benefits provided by expenditures. In the past, transportation planning only considered a limited set of impacts when evaluating transportation projects, as summarized in the following table. Basically, conventional planning favored travel speed over other goals such as affordability, social equity, public health and environmental protection. This favored automobile-focused improvements, and justified little investment in walking, bicycling, and public transit because they were considered slow and therefore inferior.
Usually Considered |
Often Overlooked |
|
|
Conventional transportation planning tends to focus on a limited set of impacts. More comprehensive planning recognizes additional benefits from non-auto modes.
For example, the old economic evaluation framework assumed that everybody—or at least everybody who matters—has an automobile and parking spaces available at every destination that would simply sit unused if they didn’t drive. As a result, the model ignored the vehicle and parking cost savings brought by shifts from driving to other modes. More comprehensive analysis considers the additional costs of automobile travel and additional benefits from non-auto modes, and so tends to justify more multimodal planning.
Conventional planning tends to undervalue non-auto mode improvements by assuming that each additional mile of their travel can reduce, at best, one vehicle mile traveled. In fact, in many situations they can leverage much larger reductions in vehicle travel, meaning that each additional mile of walking, bicycling, or public transit can reduce more than one vehicle mile due to the mechanisms described in the box below. As a result, walking, bicycling and public transit improvements can provide much larger vehicle travel reductions and benefits than is commonly recognized.
Active and Public Transport Leverage EffectsActive and public transit improvements often leverage additional vehicle travel reductions in these ways:
Not every active mode improvement has all these effects, but many small changes can help make a community more multimodal, and therefore reduce total vehicle travel. |
2. Serving Non-Auto Travel Demands
A second factor is the unmet demand for non-auto travel. In a typical community, 20 to 40 percent of travelers cannot, should not, or would prefer non-auto travel modes, as summarized in the table below. Failing to serve these needs deprives these groups of access to opportunities, and forces motorists to spend time and money chauffeuring them.
Types of Non-Auto Travel Demands
Type |
Prevalence |
|
Seniors who do not or should not drive. |
5-15% of residents and increasing. |
|
People with disabilities. |
3-5% of residents |
|
Adolescents (12-20 years) |
10-20% of residents |
|
Drivers who share vehicles and sometimes require alternatives. |
10-20% |
|
Low-income households burdened by automobile costs. |
10-30% of households |
|
Drivers who temporarily lack vehicles |
Varies |
|
Tourists and visitors |
Varies |
|
People who walk for religious reasons, such as observant Jews. |
0-3% of households |
|
People impaired or distracted by alcohol, drugs or devices. |
Varies. |
|
People who at least occasionally want to walk and bike for health and enjoyment. |
40-60% of residents |
|
Families with pets to walk. |
20% of households |
|
Motorists who want better travel options for others. |
Most motorists. |
In a typical community, 20-40 percent of travelers demand non-auto travel options.
Although few motorists want to give up driving entirely, consumer surveys indicate that many would prefer to drive less, rely more on alternative modes, and live in more compact, walkable neighborhoods, provided that those options are convenient, comfortable, and affordable. Property values tend to increase significantly with an improved Walk Score and good public transit access, indicating the value consumers place on non-auto travel.
Current demographic and economic trends are also increasing demands for non-auto travel: an aging population, rising traffic and parking congestion, urbanization, increasing poverty, rising fuel prices, increasing health and environmental concerns, plus technological innovations such as electric bikes and Mobility as a Service (MaaS). Everybody benefits if planning responds to those demands, including motorists who gain from reduced traffic and parking problems, increased safety, and reduced chauffeuring burdens.
Many communities have targets to reduce automobile traffic and increase use of resource-efficient modes to reduce traffic and parking problems, increase affordability and social equity, improve public health and fitness, and reduce energy consumption and polluting emissions.
However, the statistics often used in planning tend to underestimate non-auto travel demands, and therefore underestimate the impacts and benefits of improving these modes. Commonly-used statistics imply that demand for walking, bicycling, and public transit is tiny, but more comprehensive analysis tends to give very different results.
For example, the widely used commute mode share data tend to significantly undercount non-auto travel demand. These surveys ignore errand trips, travel by children, and recreational travel, which are more commonly made by non-auto modes. They categorizes a bike-transit-walk trip as a transit trip, and a drive-park-walk trip as an auto trip; the biking and walking links are ignored even if they involve significant travel on public facilities.
Walking, bicycling, and public transit mode shares tend to increase with urban density, as illustrated below, and so tend to be particularly high in areas with the most intense traffic and parking problems. What looks like a small increase in regional non-auto mode shares can provide large benefits if concentrated in congested corridors.
Regional, Central City and CBD Mode Shares
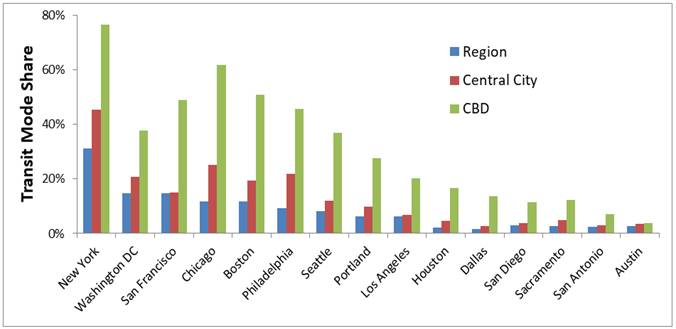
Although transit is typically just 1-3 percent of total regional mode share, it represents a larger portion of urban commuting (typically 5-10 percent) and an even greater share of peak-period travel to major activity centers such as central business districts (CBDs) and campuses (typically 10-50 percent).
These statistics reflect current levels of walking, bicycling, and public transit travel, but planning should take into account demographic and economic trends that are increasing non-auto travel demands, and the level of demand that would exist after cost-effective improvements are implemented. Experience indicates that walking, bicycling, and public transit travel can increase significantly if communities invest in them. For example, the FHWA’s Nonmotorized Transportation Pilot Program, which invested about $100 per capita in pedestrian and cycling improvements in four typical U.S. communities, increased walking trips 23 percent and bicycling trips 48 percent and reduced driving about 3 percent. Cities such as Seattle, Paris, and Fairfax have reduced per capita vehicle-travel by implementing cost effective TDM programs.
Instead of asking what portion of trips are made by non-auto modes, we can ask what portion of residents use non-auto modes at least occasionally and so value their availability. This question was explored in Professor Ralph Buehler and Andrea Hamre’s study, “The Multimodal Majority? Driving, Walking, Cycling, and Public Transportation Use Among American Adults.” It found that only 7 percent of U.S. travelers rely entirely on non-auto modes, and only 28 percent rely entirely on automobile; a majority (65 percent) use a combination of automobile and other modes at least once a week.
The graph below illustrates various indicators of non-auto travel demands. The first column shows the non-auto commute mode share, based on Census data. The second column shows total trips by non-auto modes, based on National Household Travel Survey (NHTS) data. The third column shows an estimate of total trips made by non-auto modes in larger cities where traffic problems are most severe. The fourth and fifth columns show estimates of potential non-auto mode shares if communities invested in them to the degree that is cost effective. The sixth column indicates the portion of U.S. residents who use non-auto modes at least three times per week.
U.S. Non-Auto Mode Shares (2018 ACS, 2017 NHTS, Buehler and Hamre 2015)
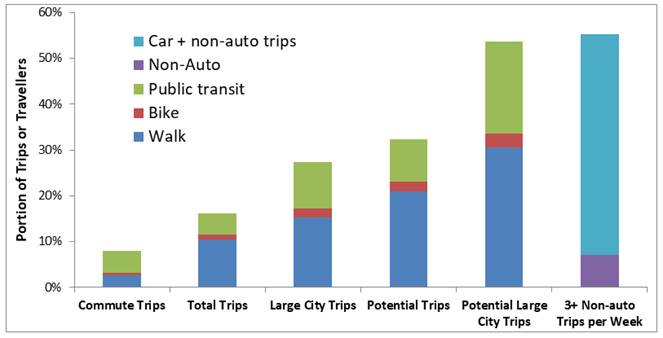
Non-auto modes serve 8 percent of commute trips, 16 percent of total personal trips, 27 percent of personal trips in large cities, and a third to half of potential trips if walking, bicycling and public transit conditions were improved. About half of all travelers use non-auto modes at least three times per week.
3. Social Equity
A third way to evaluate non-auto travel investments is based on social equity goals. Automobile dependency creates large disparities between drivers and non-drivers. Multimodal planning can reduce these disparities. Walking, bicycling, and public transit improvements help ensure that non-drivers are able to access basic services and activities. This can be evaluated using indicators such as Access to Opportunities mapping and the Transportation Security Index.
Summary
After a century of automobile-oriented planning, it is time to invest in other modes. Automobile transportation is costly. When motorists purchase a vehicle, they expect governments and businesses to spend thousands of dollars on roads and parking facilities for their use, plus permission to impose congestion, crash risks, and pollution emissions on their community. Multimodal planning can reduce these costs, providing large savings and benefits. In a typical community, 20 to 40 percent of residents will rely on non-auto travel options if they are available, and serving these demands can provide significant savings and benefits. This suggests that it is efficient and equitable for communities to spend 20 to 40 percent of their transportation dollars and road space on walking, bicycling, and public transit, and even more to make up for a century of car-centric planning. This would represent a considerable increase over current practices.
Multimodal planning faces many obstacles. Many North Americans have never lived in a multimodal community and are unfamiliar with the efficiencies and benefits it can provide. Current transportation data tends to undercount and undervalue non-auto modes. Many planning and budgeting practices are biased in favor of car-centric improvements. Below are some suggestions for overcoming these challenges and implementing multimodal planning to an optimal degree.
- Identify the full costs of automobile-dependent transportation systems, and the many savings and benefits provided by more multimodal planning, including direct benefits to users and community-wide benefits.
- Provide information on these benefits suitable for various audiences including residents, motorists, public health professionals, local businesses, people with disabilities, low-income families, and environmental advocates.
- Define and measure non-auto travel demand. Identify groups that cannot, should not, or prefer not to drive everywhere. Identify demographic and economic trends that are likely to increase non-auto travel demands.
- Estimate latent demands and the additional walking, bicycling, and public transit travel likely to result from improvements in these modes.
- Identify the social equity benefits provided by more multimodal planning. Identify the investments needed to ensure that everybody, including people with disabilities, low incomes, and other disadvantaged communities, can access essential services and activities.
For more information:
Marlon G. Boarnet, et al. (2017), The Economic Benefits of Vehicle Miles Traveled (VMT)-Reducing Placemaking: Synthesizing a New View, National Center for Sustainable Transportation.
Ralph Buehler and Andra Hamre (2015), “The Multimodal Majority? Driving, Walking, Cycling, and Public Transportation Use Among American Adults,” Transportation 42, 1081–1101.
ITF (2021), Reversing Car Dependency, International Transport Forum.
Todd Litman (2013), “The New Transportation Planning Paradigm,” ITE Journal, Vo. 83, No. 6, pp. 20-28.
Todd Litman (2021), Evaluating Transportation Diversity: Multimodal Planning for Efficient and Equitable Communities, Victoria Transport Policy Institute.
Susan Handy (2020), What California Gains from Reducing Car Dependence, National Center for Sustainable Transportation.
María del Mar Parra López, Jan Anne Annema and Bert van Wee (2022), “The Added Value of Having Multiple Options to Travel to. An Explorative Study,” Journal of Transport Geography, Vo. 98.
Giulio Mattioli, et al. (2020), “The Political Economy of Car Dependence: A Systems of Provision Approach,” Energy Research & Social Science, Vo. 66.
Gregory H. Shill (2019), “Americans Shouldn’t Have to Drive, but the Law Insists on It; The Automobile Took Over Because the Legal System Helped Squeeze out the Alternatives,” The Atlantic.


L.A. Times: California Must Shift Transportation Spending Priorities
Despite its ambitious emissions reduction goals, California continues to spend a majority of transportation funds on car-centric infrastructure.

Houston Inches Toward Reduced Car Dependency
The city is investing more in biking, walking, and public transit, but a lack of funding and counterproductive moves from the Texas Department of Transportation are slowing the process of shifting away from personal automobile dependency.

Southeast LA Road Safety Advocates Call for Improved Infrastructure
Streets in southeastern Los Angeles County have a severe lack of protected bike lanes and traffic safety measures, leading to high numbers of fatalities in a community where many residents depend on walking and biking for daily needs.

Planetizen Federal Action Tracker
A weekly monitor of how Trump’s orders and actions are impacting planners and planning in America.

Chicago’s Ghost Rails
Just beneath the surface of the modern city lie the remnants of its expansive early 20th-century streetcar system.

Amtrak Cutting Jobs, Funding to High-Speed Rail
The agency plans to cut 10 percent of its workforce and has confirmed it will not fund new high-speed rail projects.

Ohio Forces Data Centers to Prepay for Power
Utilities are calling on states to hold data center operators responsible for new energy demands to prevent leaving consumers on the hook for their bills.

MARTA CEO Steps Down Amid Citizenship Concerns
MARTA’s board announced Thursday that its chief, who is from Canada, is resigning due to questions about his immigration status.

Silicon Valley ‘Bike Superhighway’ Awarded $14M State Grant
A Caltrans grant brings the 10-mile Central Bikeway project connecting Santa Clara and East San Jose closer to fruition.
Urban Design for Planners 1: Software Tools
This six-course series explores essential urban design concepts using open source software and equips planners with the tools they need to participate fully in the urban design process.
Planning for Universal Design
Learn the tools for implementing Universal Design in planning regulations.
Caltrans
City of Fort Worth
Mpact (founded as Rail~Volution)
City of Camden Redevelopment Agency
City of Astoria
City of Portland
City of Laramie