


The city of Nashville launched the NashView interactive data map earlier this month.
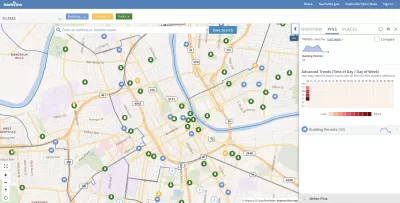
"Nashville Mayor Megan Barry has launched an interactive data map, called NashView, that the public can use to see information about a number of government-provided services," reports Katie Pyzyk.
"NashView offers visualizations using markers and a wide variety of maps, as well as options to sort by Metro Council district, school district, and zip code," according to the press release announcing the new data platform. "Residents can track the number, concentration and other traits of various occurrences in their neighborhoods and around the city – without special software, skills or access."
FULL STORY: Nashville launches public-facing community data map


DataUSA: An Intuitive Tool for Public Data
A collaboration between Deloitte, Datawheel, and MIT has produced an intuitive aesthetically-pleasing gathering point for public data in the United States. Specific locations and industries boast easy-to-read profiles.
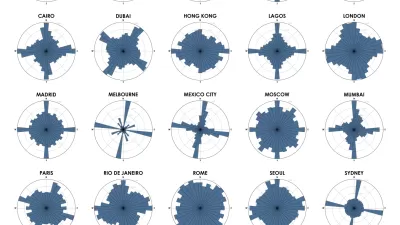
Chart Your City's Street Network to Understand its Logic
The roads in your city might conform to a grid, or they might divert around natural resources or landmarks. A new tool aims to help you visualize the "hidden logic" behind urban growth.

Metrorail Travel Patterns Revealed
Commute data for one of the nation's premier rail transit systems, revealed.

Maui's Vacation Rental Debate Turns Ugly
Verbal attacks, misinformation campaigns and fistfights plague a high-stakes debate to convert thousands of vacation rentals into long-term housing.

Planetizen Federal Action Tracker
A weekly monitor of how Trump’s orders and actions are impacting planners and planning in America.

San Francisco Suspends Traffic Calming Amidst Record Deaths
Citing “a challenging fiscal landscape,” the city will cease the program on the heels of 42 traffic deaths, including 24 pedestrians.

Defunct Pittsburgh Power Plant to Become Residential Tower
A decommissioned steam heat plant will be redeveloped into almost 100 affordable housing units.

Trump Prompts Restructuring of Transportation Research Board in “Unprecedented Overreach”
The TRB has eliminated more than half of its committees including those focused on climate, equity, and cities.

Amtrak Rolls Out New Orleans to Alabama “Mardi Gras” Train
The new service will operate morning and evening departures between Mobile and New Orleans.
Urban Design for Planners 1: Software Tools
This six-course series explores essential urban design concepts using open source software and equips planners with the tools they need to participate fully in the urban design process.
Planning for Universal Design
Learn the tools for implementing Universal Design in planning regulations.
Heyer Gruel & Associates PA
JM Goldson LLC
Custer County Colorado
City of Camden Redevelopment Agency
City of Astoria
Transportation Research & Education Center (TREC) at Portland State University
Jefferson Parish Government
Camden Redevelopment Agency
City of Claremont