


Uber users are getting massive amounts of value from the service, according to a new analysis only possible in the post-transportation network company era.
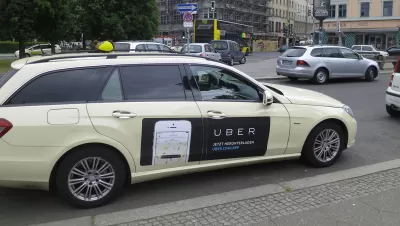
"Uber has created more than a booming ride-sharing market," according to an article by Adam Creighton. "It’s given economists a treasure trove of data to understand one of the fundamental concepts of economics: the demand curve."
Steven Levitt, author of the best-selling Freakonomics, along with other researchers at the University of Chicago and Oxford worked together with Uber to map out the Uber demand curve, "showing U.S. consumers alone are reaping billions of dollars a year in benefits, far greater than the losses borne by taxi owners."
Such a demand curve was considered "nearly impossible," writes Creighton, until Uber came along. Uber's platform allows the collection of data on a number of the variables that make demand so volatile (i.e., price changes alone don't account for why people buy goods or services):
Uber’s data is unique in two crucial ways. It records not only the time, place, price, and demand-and-supply conditions of every paid ride (encapsulated in a surge factor), but also of every occasion where a customer declines the offered price.
Click through to the article to find out exactly how the new research quantifies Uber's demand curve, along with the implications of the new research on another tricky economic concept: consumer surplus.
[The Wall Street Journal could be blocked by a paywall.]
FULL STORY: Uber’s Pricing Formula Has Allowed Economists to Map Out a Real Demand Curve

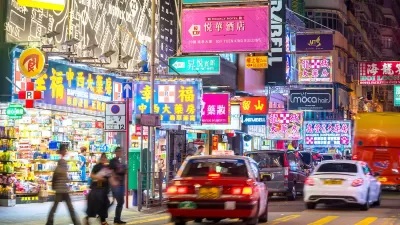
Hong Kong Cab Hailing App Folds — and Uber Takes Over
HKTaxi launched a year before Uber came to town. Now, it’s shutting down. Lawmakers worry a monopoly looms.
Minnesota Lawmakers Reach Ride Share Compromise
A law awaiting the governor’s signature establishes wage rates for drivers. Ride share companies say if the law passes, they plan to continue service in the state.
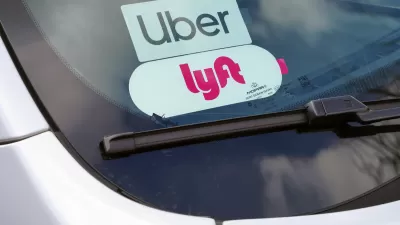
Uber Sees Record Ridership, Finally Posts a Profit
The ride-hailing giant posted an operating profit for the first time in its history, thanks largely in part to its successful food delivery business.

Montreal Mall to Become 6,000 Housing Units
Place Versailles will be transformed into a mixed-use complex over the next 25 years.

Planetizen Federal Action Tracker
A weekly monitor of how Trump’s orders and actions are impacting planners and planning in America.

DARTSpace Platform Streamlines Dallas TOD Application Process
The Dallas transit agency hopes a shorter permitting timeline will boost transit-oriented development around rail stations.

Without International Immigrants, the Rural US Population Would Be Falling 58%
Census data shows that population growth in rural areas is due in large part to international migrants.

Dead End: Nine Highways Ready for Retirement
The Freeways Without Futures report describes the nation’s most promising highway removal proposals.

Congressman Proposes Bill to Rename DC Metro “Trump Train”
The Make Autorail Great Again Act would withhold federal funding to the system until the Washington Metropolitan Area Transit Authority (WMATA), rebrands as the Washington Metropolitan Authority for Greater Access (WMAGA).
Urban Design for Planners 1: Software Tools
This six-course series explores essential urban design concepts using open source software and equips planners with the tools they need to participate fully in the urban design process.
Planning for Universal Design
Learn the tools for implementing Universal Design in planning regulations.
City of Mt Shasta
City of Camden Redevelopment Agency
City of Astoria
Transportation Research & Education Center (TREC) at Portland State University
City of Camden Redevelopment Agency
Municipality of Princeton (NJ)
Regional Transportation Commission of Southern Nevada