


When gas prices fall, discretionary transit riders also spend less on transit according to an analysis of credit and debit card bills by the JP Morgan Chase Institute.
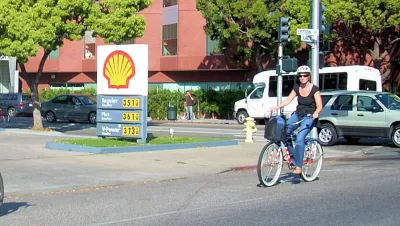
"For every dollar saved from lower gas prices at the pump, households decreased their spending on transit by some 14 cents,” stated Diana Farrell, president and CEO of the JPMorgan Chase Institute, a separate research arm of the bank.
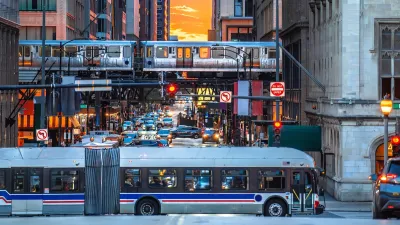
transit ridership in Chicago.
"In the two months that fuel prices have been well below $3 we have not seen any significant shifts on either the rail side or the bus side," says Brian Steele, a spokesman for the Chicago Transit Authority.
Indeed, CTA experienced a record number of rail passengers last year, but also saw bus ridership drop.
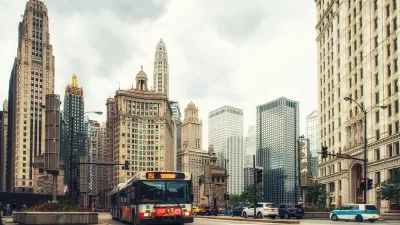
There may be better data for how higher gas prices affect transit ridership, according to Marshall-Genzer.
"When it’s over three dollars per gallon, then we do see riders starting to make those shifts," explained Robert Puentes, president and CEO of the Eno Center for Transportation.
Perhaps the JP Morgan Chase Institute could chart a relationship between transit payments and payments to transportation network companies like Uber and Lyft next as they would seem to be likely beneficiaries during Metro's service disruptions.
FULL STORY: How low gas prices affect mass transit's bottom line

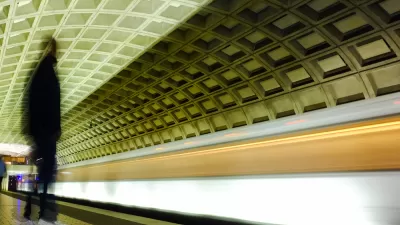
SafeTrack Over, Metro D.C.'s Ridership Continues to Decline
Greater Greater Washington's "Metro Reasons" column analyses the latest ridership data from the D.C. Metro system. Riders have not returned to the system after the SafeTrack repair program concluded in 2017.
Chicago Transit Agencies on Brink of Major Crisis
Without additional funding, regional transit agencies will be forced to cut services by 40 percent.
Study: Most Chicago Rideshare Trips Could Be Made by Transit
Researchers found that 99 percent of rideshare trips could be made by buses and trains — but the time savings roughly equal an hour’s wage.

Maui's Vacation Rental Debate Turns Ugly
Verbal attacks, misinformation campaigns and fistfights plague a high-stakes debate to convert thousands of vacation rentals into long-term housing.

Planetizen Federal Action Tracker
A weekly monitor of how Trump’s orders and actions are impacting planners and planning in America.

San Francisco Suspends Traffic Calming Amidst Record Deaths
Citing “a challenging fiscal landscape,” the city will cease the program on the heels of 42 traffic deaths, including 24 pedestrians.

Half of Post-Fire Altadena Home Sales Were to Corporations
Large investors are quietly buying up dozens of properties in Altadena, California, where a devastating wildfire destroyed more than 6,000 homes in January.

Opinion: What San Francisco’s Proposed ‘Family Zoning’ Could Really Mean
Mayor Lurie is using ‘family zoning’ to encourage denser development and upzoning — but could the concept actually foster community and more human-scale public spaces?

Jacksonville Launches First Autonomous Transit Shuttle in US
A fleet of 14 fully autonomous vehicles will serve a 3.5-mile downtown Jacksonville route with 12 stops.
Urban Design for Planners 1: Software Tools
This six-course series explores essential urban design concepts using open source software and equips planners with the tools they need to participate fully in the urban design process.
Planning for Universal Design
Learn the tools for implementing Universal Design in planning regulations.
Gallatin County Department of Planning & Community Development
Heyer Gruel & Associates PA
JM Goldson LLC
City of Camden Redevelopment Agency
City of Astoria
Transportation Research & Education Center (TREC) at Portland State University
Jefferson Parish Government
Camden Redevelopment Agency
City of Claremont