


Will planning horizons of 25 to 30 years make sense as transportation technology speeds through unprecedented rates of innovation?

Future transportation projects and services may have far different impacts than is currently the case, and planners may be challenged both by estimating novel forms of impact and overcoming the prevailing perceptions amongst professionals, policy makers, and the public.
I've long been intrigued with varying levels of effort and accuracy in assessing the longer-range implications of transportation policy and investment decisions. It is common to assess impacts 25 or 30 years in the future. For capital intensive projects, this comparison point design year often occurs when the investment is perhaps 15 years old (as it takes 10- to 15-plus years to implement many long-range plan projects) and perhaps halfway through the life of the asset being studied. As we are now entering a time period with an even greater pace of change, it is becoming increasingly difficult to assess both the market acceptance of an investment as well as its performance and impacts.
The energy use and environmental impacts of transportation provide good examples of this dilemma. In the first session of every course I teach, we do round-robin introductions where students share their motivations for taking the course. When I teach a public transit course, it's not uncommon for a third or more of the students to express their motivation to address climate change and energy challenges by providing better public transportation. The implicit assumption is that public transportation is a more resource efficient means of moving people. That premise is indeed supported by historic and particularly international conditions, where public transportation has been able to deliver resource efficient mobility. However, the world has been changing, and evidence suggests the pace of change is quickening. Not only do we struggle to develop reasonable future year assumptions, but often planners don't even rely on the most current or contextually relevant data on modal efficiencies when evaluating design year conditions. So for fun, let's look at the energy use metrics for electric means of urban travel.
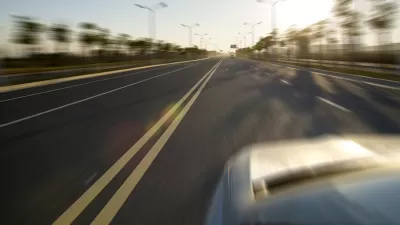
Energy efficiency and emissions are critical considerations for a significant share of the public, and they are also significantly influenced by technology. This example looks exclusively at electric vehicles, where power generation and transmission efficiency differences can be ignored and only point of consumption of energy use is compared (making a 10 percent adjustment for charging inefficiencies for battery powered personal vehicles). Imagine, for example, evaluating transportation investments for a 2040 design year, when one might reasonably expect a large share of the vehicle fleet, particularly for urban operations, to be electrically powered vehicles. The table below itemizes energy efficiencies per passenger mile for various technologies that exist today. Admittedly, these technologies are likely to evolve over time, and the composition of the vehicle fleet operating on a planned facility is likely to change over time. In addition, the energy ratings for personal vehicles may not match real-world deployment. The light rail vehicle numbers shown in the table represent agency reported actual energy consumption in real operating conditions for several newer light rail systems.

Notes
1. Energy use based on USEPA MPGe ratings debited 10 percent to account for charging efficiency, occupancy based on 2008 NHTS average of work occupancy and overall personal vehicle occupancy.
2. Tuber might be the car developed by the partnership between Toyota and Uber while Goof might be the code name for the Google and Ford partnership. Or perhaps a Google and Uber partnership will produce a Guber vehicle. Low occupancies may result from these automated vehicles shuttling empty between assignments.
3. Energy use based on the company website assumes no charging losses, average bus occupancy based on APTA Public Transportation Fact Book, 2015, Table 5 bus passenger miles, Table 6 bus vehicle miles.
4. Based on Federal Transit Administration 2014 test of BYD 40 foot electric bus.
5. Based on manufacturer's website data; debited 10 percent for charging losses.
6. Based on 2013 agency submittals to the National Transit Database, LRT electricity use, passenger miles of travel, and vehicle miles of travel.
The data in the table is likely to surprise individuals who have not closely followed changes in energy consumption and vehicle utilization. This table suggests two sets of observations:
Comparative energy efficiency:
- To the extent that the future means of transportation are electrically powered with efficiencies similar to those available today, the personal vehicle performs very favorably on an energy use per passenger mile basis given utilization and occupancy levels characteristically observed today.
- Not surprisingly, energy efficiency is highly dependent upon utilization of the vehicle's capacity. The relatively modest utilization levels for light rail transit vehicles in the newer systems shown significantly dampen their net energy efficiency.
- The Proterra electric bus, to the extent that it is able to obtain the projected energy efficiency levels associated with its MPGelevel look quite promising.
- A host of other considerations including access and egress modes, trip circuity, and energy associated with infrastructure development are excluded from this comparison.
- Private vehicles would use one-third less energy than light rail vehicle travel, given the technology and utilization assumptions shown above. Electric busses could perform better, and personal electric vehicles, such as a motorcycle, or perhaps other emerging electric personal mobility hardware, are even more efficient.
Implications for planning:
- The pace of change, performance, and deployment of transportation and energy technologies will challenge planners to present well-informed estimates of project impacts as they deviate from historic norms.
- The net performance of various investments and services are highly dependent upon whether or not their utilization levels leverage the capacity of the investments. Efficient technologies and vehicles are only efficient when deployed in environments with sufficient utilization levels.
- The fundamental ability to scale technologies, such as electrical propulsion systems and vehicles, to market conditions (probable passenger loads) may undermine some of the historic scale of the economy efficiency that applied to larger vehicles and trains of vehicles. We may similarly see different abilities to scale cost, capacity, performance, and other aspects of transportation in incremental ways not previously available. Similarly, future systems might be updated in terms of performance and impacts on a more frequent basis depending on the nature of the system and the capital intensiveness and economic operating life of the asset. For example shorter life components can be updated or replaced more frequently, taking advantage of the newest technologies and materials.
- The benefits of investments might be dependent on secondary effects, which can be even more challenging to forecast. For example, a recent Transportation Research Board report indicated that transit investments, by impacting development patterns, can have vehicle mile of travel impacts four times greater than the direct substitution effect by virtue of influencing the number and length of vehicle trips (TCRP Report 176). The acknowledged high variability and context sensitivity of estimates of this effect suggests a high degree of uncertainty in estimating these secondary impacts.
This scenario only touches on the challenges of planning for future transportation needs. The prospects of business models that treat mobility as a service, emerging technologies and propulsion systems, and ultimately automated vehicles, coupled with economic and demographic changes, create an extraordinarily challenging planning environment. Various analysts have speculated on the changes in the demand for travel with highly variable scenarios each having credible back-stories (Ken Laberteaux, Suzanne Childress, Johanna Zmud, Zia Wadud). Planners will be left with the daunting task of identifying plans that accommodate uncertain mobility needs, evaluating those plans credibly and objectively, potentially challenging current perceptions, and communicating risk and uncertainty to the decision-makers. That should be enough to keep planners busy for a while.
The opinions are those of the author—or maybe not—but are intended to provoke reflection and do not reflect the policy positions of any associated entities or clients. [email protected]

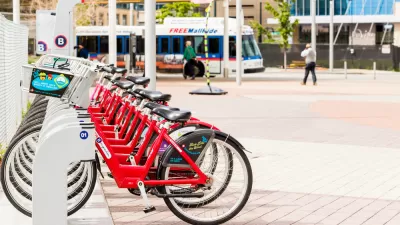
9 Transportation Innovations from U.S. Cities
Curbed surveys the nation for cities leading the push toward more sustainable, equitable, and effective transportation systems.
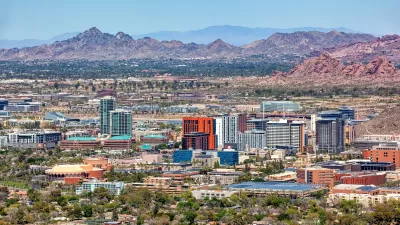
‘Tempe Tomorrow’ Plans for Expected Population Growth
Tempe planners are preparing a General Plan update scheduled for voter approval in March 2024.

Sioux Falls Multi-Family Development Outpaces Transportation Improvements
Sioux Falls, South Dakota is undergoing a multi-family development boom. Residents are increasingly concerned about the traffic the development brings, according to local news reports.

Planetizen Federal Action Tracker
A weekly monitor of how Trump’s orders and actions are impacting planners and planning in America.

Map: Where Senate Republicans Want to Sell Your Public Lands
For public land advocates, the Senate Republicans’ proposal to sell millions of acres of public land in the West is “the biggest fight of their careers.”

Restaurant Patios Were a Pandemic Win — Why Were They so Hard to Keep?
Social distancing requirements and changes in travel patterns prompted cities to pilot new uses for street and sidewalk space. Then it got complicated.

Platform Pilsner: Vancouver Transit Agency Releases... a Beer?
TransLink will receive a portion of every sale of the four-pack.

Toronto Weighs Cheaper Transit, Parking Hikes for Major Events
Special event rates would take effect during large festivals, sports games and concerts to ‘discourage driving, manage congestion and free up space for transit.”

Berlin to Consider Car-Free Zone Larger Than Manhattan
The area bound by the 22-mile Ringbahn would still allow 12 uses of a private automobile per year per person, and several other exemptions.
Urban Design for Planners 1: Software Tools
This six-course series explores essential urban design concepts using open source software and equips planners with the tools they need to participate fully in the urban design process.
Planning for Universal Design
Learn the tools for implementing Universal Design in planning regulations.
Heyer Gruel & Associates PA
JM Goldson LLC
Custer County Colorado
City of Camden Redevelopment Agency
City of Astoria
Transportation Research & Education Center (TREC) at Portland State University
Camden Redevelopment Agency
City of Claremont
Municipality of Princeton (NJ)