"Not knowing which kinds of buildings consume what is like not being able to gauge differences between a diesel truck and a hybrid car."


Laura Bliss reports on a new tool produced by Stephanie Pincetl, a UCLA environmental planning scholar, and her colleagues at the California Center for Sustainable Communities to measure the energy use of buildings around Los Angeles County.
The Energy Atlas, as it's known, provides a database that "charts and maps previously unreleased data on household natural gas and electricity consumption obtained from utilities alongside Census records." Bliss also adds that the Energy Atlas is "fully searchable: The curious can sort L.A.’s energy use by income, neighborhood, energy type, building age, and plenty of other measures."
Bliss then puts the Energy Atlas to good use, exploring its database for a few conclusions about energy use in Los Angeles. So, for instance, Bliss uncovers this probably-not-at-all surprising revelation: "Given that low-income families tend to live in multi-family buildings, perhaps it’s not surprising that the highest energy users were also those with the highest incomes. Residents of wealthy beachside Malibu used more than 10 times more energy per capita than those in working-class Bell, a city south of east L.A."
Read the full story: L.A.'s New 'Energy Atlas' Maps Who Sucks the Most Off the Grid

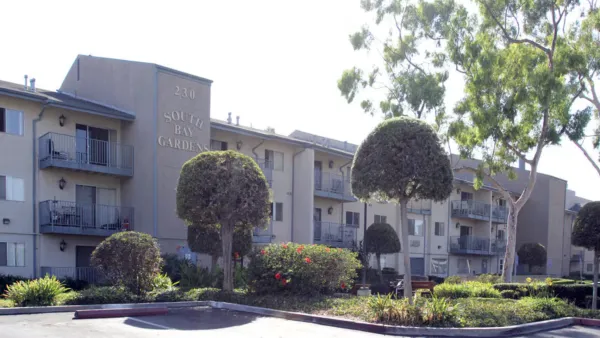
Los Angeles opens public housing waitlist for first time in over two years
The 16 properties with newly available waitlist spots accept families and senior residents.
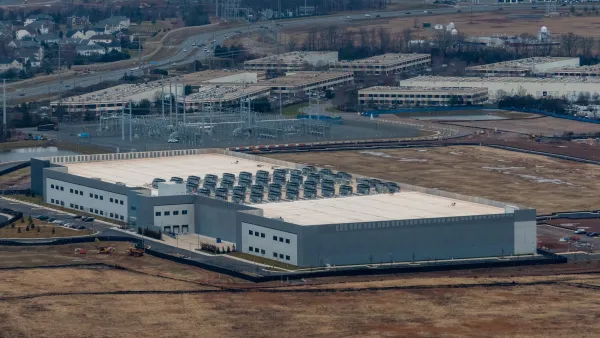
Data center developer offers over $4M per acre to buy out homeowners
Data center builders are outbidding home builders for land, prompting concerns about competition with housing.
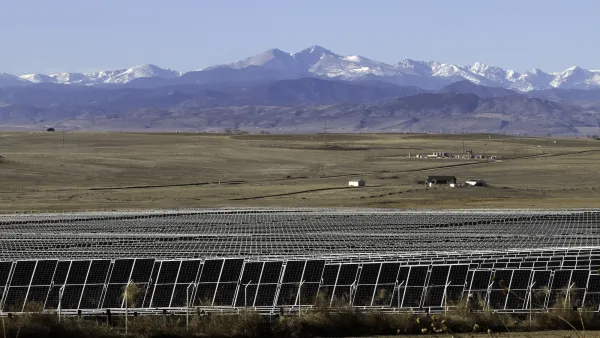
Over half of Colorado's energy now comes from renewables
In the first quarter of 2026, renewables made up 53% of Colorado's electricity, up from 43% in 2025.
Planetizen Federal Action Tracker
A weekly monitor of how Trump’s orders and actions are impacting planners and planning in America.
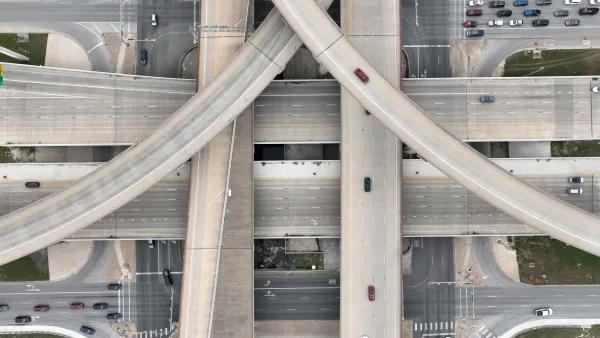
The state-sanctioned urbicide of Austin
People don’t kill cities. Freeways do.
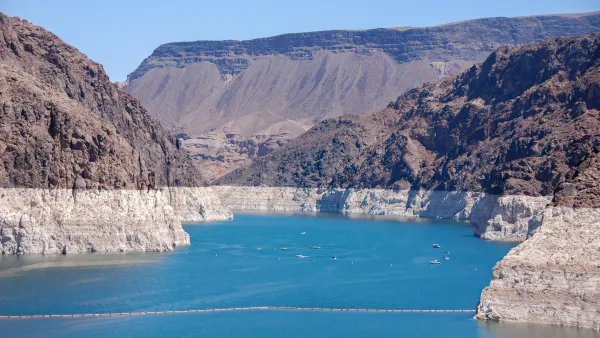
US to reduce Colorado River water deliveries to Mexico
A new Colorado Treaty amendment reduces Mexico’s Colorado River water allocation by 250,000 acre feet.

Nation's most wind-powered state turns to coal as data centers increase energy demand
For the first time in decades, Iowa has increased its generation of coal power.

NYC cools commuters with city's first rain garden above a bus stop
New York City officials say the plants in the rain garden can absorb 16 gallons of rainwater during heavy storms.

Brightline West’s future may rely on $6 billion federal loan
The company has until Nov. 2 to make a $400 million equity investment into its proposed high-speed rail line.

FREE Course: Walkable City 1: Why Walkability?
After describing his path towards focusing on walkability as the essence of good planning, Jeff Speck marches through his five principal reasons for making more walkable places.
Reinventing Malls: Planning Alchemy—Turning Gray Fields Into Gold
The course focuses on the opportunities and imperatives that shape reinvention of mall sites.

Greater Baltimore Committee
Eagle County Government
Harvard University Graduate School of Design
The Architects Foundation
University of Cincinnati Online
The Pocatello Development Authority
The Urban Renewal Agency of the City of Pocatello
Journal of the American Planning Association