


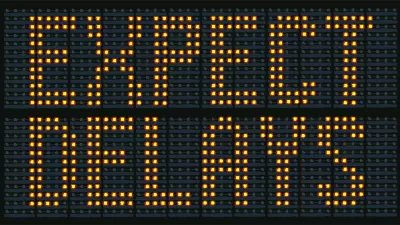
INRIX, a traffic analysis company, recently released its 100 Most Congested Metros list. Los Angeles and New York predictably come out on top, but the more interesting finding is that traffic has increased significantly.
On average, says INRIX, traffic is up 10% since 2009. Why?
Population growth and an increase in interstate traffic due to the economic recovery, says INRIX.
They conclude, "When employment returns to 2007 levels, 9 MILLION more daily commute trips than 2010 levels will need to be accomodated, further stressing America's urban highway network."
And predictably, corridors that have the worst congestion will attract more congestion:
"We fully expect-should growth continue and particularly if job growth picks up-to see congested corridors get longer in length, have delays more hours of each day, and see slower traffic while congested. This triple whammy of longer (length), longer (time), and slower is likely to be the primary contributor to congestion growth in 2011, as it appears to have been in 2010."
FULL STORY: INRIX National Traffic Scorecard


Conservatives’ Decongestion Pricing Flip-Flop
When it comes to solving traffic problems, the current federal administration is on track for failure, waste, and hypocrisy.

Why Traffic Never Gets Better
Despite abundant research showing that roadway expansions provide limited congestion relief and increase long-term traffic problems, they still occur due to wishful thinking: advocates claim that “this” project is different.
A Serious Critique of Congestion Costs and Induced Vehicle Travel Impacts
Some highway advocates continue to claim that roadway expansions are justified to reduce traffic congestion. That's not what the research shows. It's time to stop obsessing over congestion and instead strive for efficient accessibility.

Planetizen Federal Action Tracker
A weekly monitor of how Trump’s orders and actions are impacting planners and planning in America.

Map: Where Senate Republicans Want to Sell Your Public Lands
For public land advocates, the Senate Republicans’ proposal to sell millions of acres of public land in the West is “the biggest fight of their careers.”

Restaurant Patios Were a Pandemic Win — Why Were They so Hard to Keep?
Social distancing requirements and changes in travel patterns prompted cities to pilot new uses for street and sidewalk space. Then it got complicated.

Platform Pilsner: Vancouver Transit Agency Releases... a Beer?
TransLink will receive a portion of every sale of the four-pack.

Toronto Weighs Cheaper Transit, Parking Hikes for Major Events
Special event rates would take effect during large festivals, sports games and concerts to ‘discourage driving, manage congestion and free up space for transit.”

Berlin to Consider Car-Free Zone Larger Than Manhattan
The area bound by the 22-mile Ringbahn would still allow 12 uses of a private automobile per year per person, and several other exemptions.
Urban Design for Planners 1: Software Tools
This six-course series explores essential urban design concepts using open source software and equips planners with the tools they need to participate fully in the urban design process.
Planning for Universal Design
Learn the tools for implementing Universal Design in planning regulations.
Heyer Gruel & Associates PA
JM Goldson LLC
Custer County Colorado
City of Camden Redevelopment Agency
City of Astoria
Transportation Research & Education Center (TREC) at Portland State University
Camden Redevelopment Agency
City of Claremont
Municipality of Princeton (NJ)