There are good reasons to be skeptical of highway industry claims that traffic congestion is a growing problem. Their analysis is often incomplete and biased. Let’s pull back the curtain on some major congestion cost studies.



This is the second of a three-part series on how best to define, evaluate and solve traffic congestion problems. Read Part 1 here.
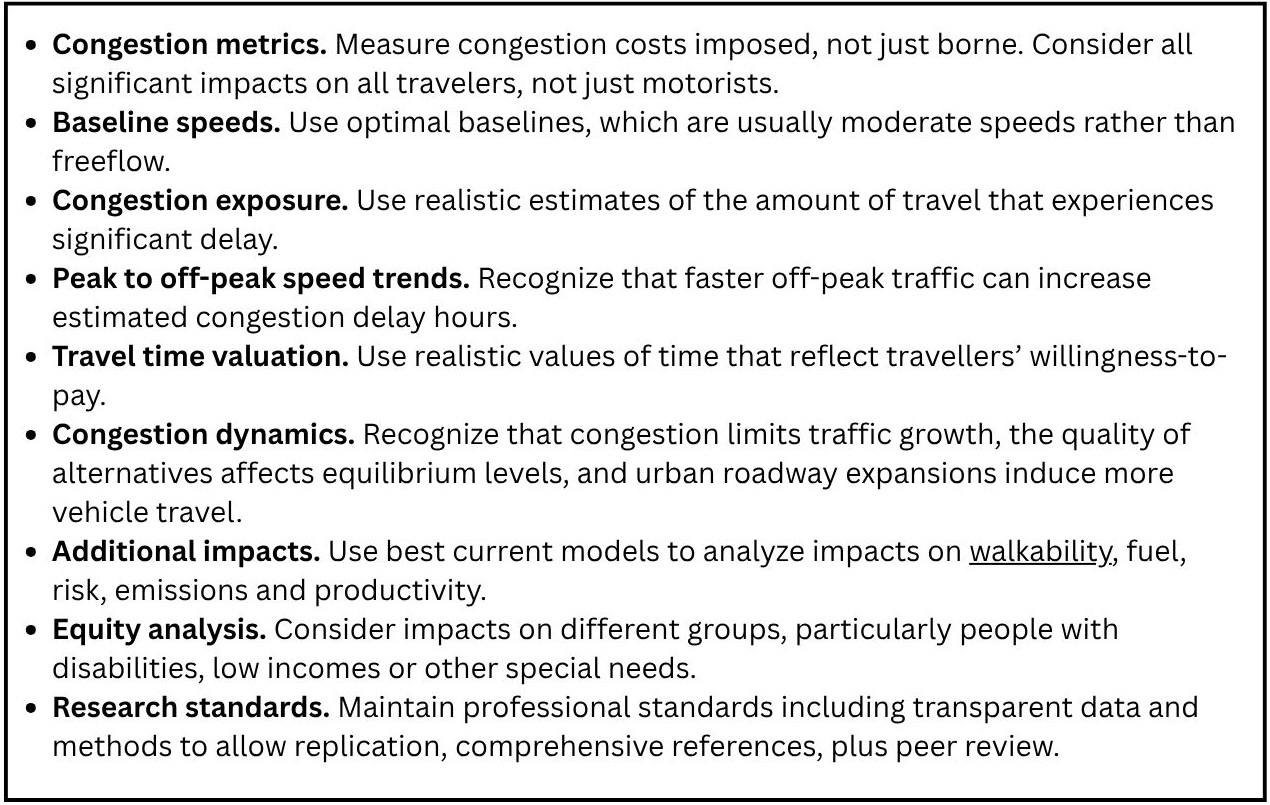
My previous column, Congestion evaluation best practices, describes factors to consider when evaluating traffic congestion (See the box below for key issues). This column investigates how well these practices are applied in widely cited congestion cost studies.
Congestion costing best practices
For example, the Texas Transportation Institute’s Urban Mobility Report (UMR) estimates that in 2024 congestion costs averaged $1,480 per American/motorist/commuter (it uses these terms interchangeably), or about $3.20 per commute trip. Its press release states, "Traffic hits record high as commuters rewrite the rush hour. Americans lost an average of 63 hours sitting in traffic in 2024 — the highest level ever measured... That’s the equivalent of nearly eight full workdays lost to traffic and marks a 16 percent increase in national congestion costs over the last five years, now totaling $269 billion annually."
Similarly, the INRIX Global Traffic Scorecard claims that congestion caused average urban motorists 49 annual delay hours worth $894, or about $2 per commute trip, and the TomTom Traffic Index estimates that congestion increases average urban-peak trip duration 19% overall, with higher rates in many cities.
Are these claims realistic? Do average Americans really lose eight workdays stuck in traffic? Would urban commuters willingly pay $3.20 tolls to avoid eight minutes of delay per trip? Did congestion costs really increase 16% during the last five years and tripled during the last forty?
I don’t think so.
Of course, traffic congestion can be costly. Many urban roads frequently have moderate delays (level of service C or D) and occasionally severe delays (level of service E or F), and most drivers can describe trips spoiled by unexpected congestion, and situations in which they would happily pay tolls to avoid delays, but those are exceptions. Motorists usually treat congestion like sailors treat tides: a predictable force to consider when planning trips. New traffic apps like INRIX and TomTom allow travellers to optimize trip timing, mode and route, minimizing delay costs.
Most congestion imposes minimal costs — it causes motorists to spend a few extra minutes listening to music or podcasts in the comfort of their vehicles. I see no evidence that most motorists are willing to pay significantly more to reduce congestion. There is no popular movement to increase taxes to finance roadway expansions, and only a minority of drivers choose to pay optional tolls to use uncongested lanes.
My research identifies several ways that congestion impact studies overestimate costs:
- They use freeflow baselines (the reference speed used to calculate delays) that exceed what is legal, efficient and safe, so much of what they call congestion costs is actually traffic law compliance — drivers slowing to legal limits.
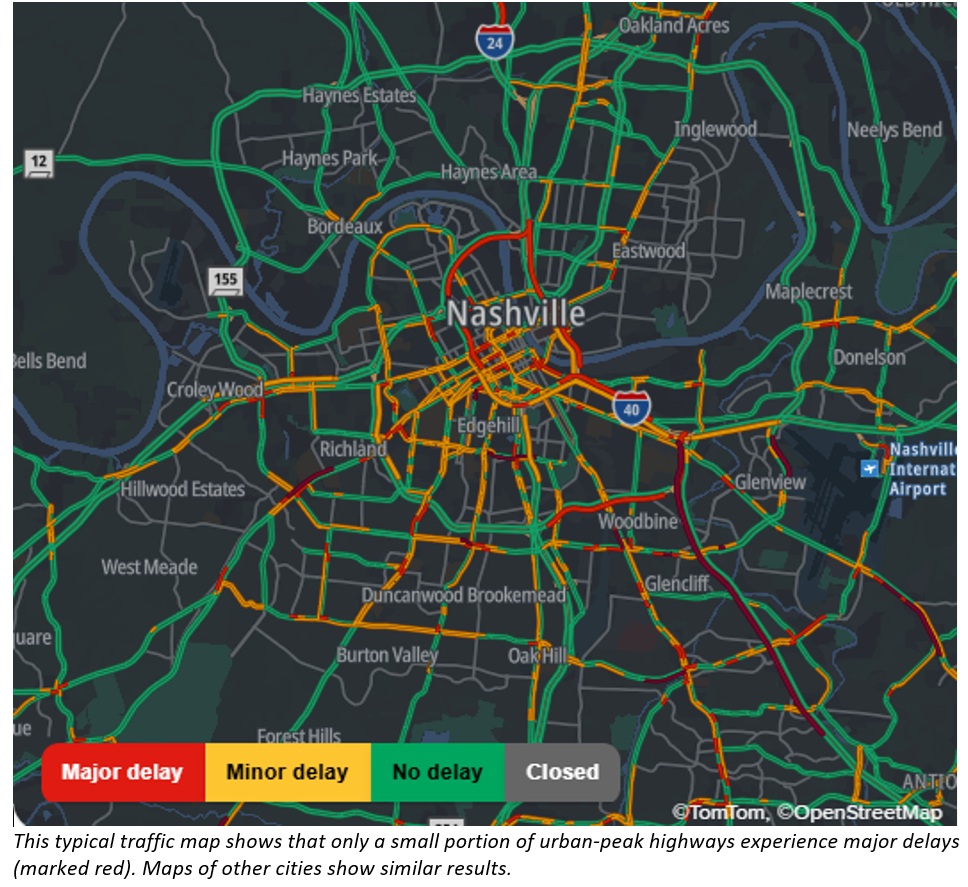
- They overestimate congestion exposure (the amount of travel that experiences delay) by applying an urban region’s highest delay levels to many trips that experience little congestion. For example, the UMR assumes that 158 million auto commuters experience significant congestion, including many with off-peak, suburban, reverse commute and local trips. It claims that 40% of urban-peak travel experiences severe or extreme congestion and only 1% is uncongested, although traffic maps, such as the example below, show that even during peak periods only a small portion of roadways have major delays.
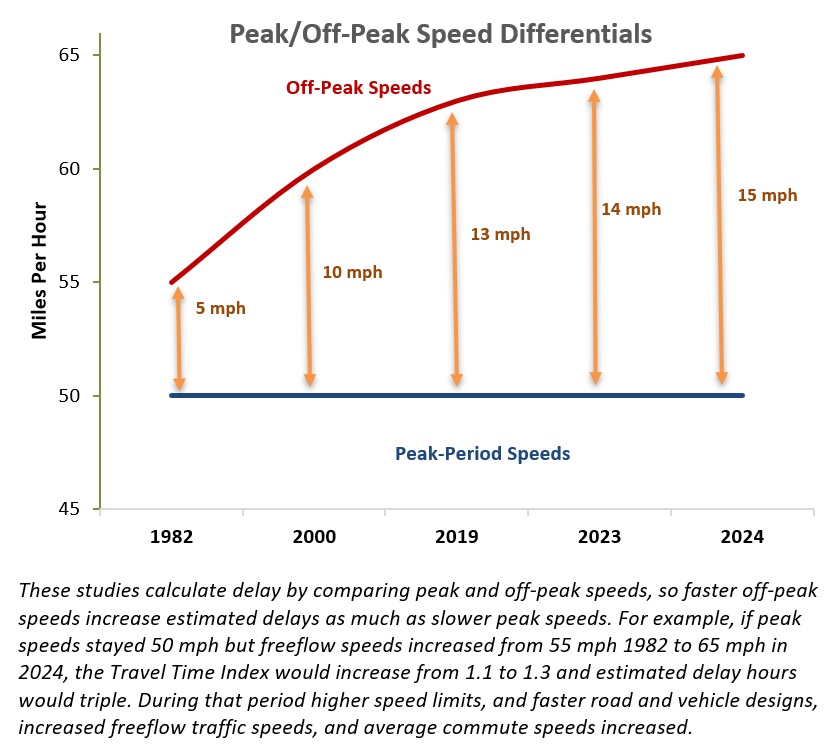
- They overestimate long-term congestion growth. For example, the UMR estimates that delay per driver approximately tripled between 1982 and 2024, but this is not reflected by other travel data; commute travel speeds increased during that period. Their analysis is biased: these studies calculate delays based on peak to off-peak speed differentials, so faster off-peak traffic increases their estimated congestion costs. During the last forty years freeflow speeds increased significantly due to higher speed limits, increased roadway design speeds, faster vehicles and reduced enforcement which caused estimated delays to increase significantly, as illustrated below. This explains the UMR’s claimed congestion cost growth.
- They overvalue delays compared with motorists’ willingness to pay for small travel time savings, and ignore ways that new technologies are reducing these costs. For example, the UMR values delay at 100% of median wages, which is twice the 50% rate that most experts recommend, and assumes 1.5 average peak-period vehicle occupants which is much higher than the 1.08 commute trip average. New traffic apps help travellers optimize time, mode and route to minimize unexpected delays, reducing congestion costs.
- They ignore congestion dynamics, the tendency of congestion to maintain equilibrium and for roadway expansions to induce more vehicle travel. Ignoring these effects exaggerates future congestion problems and roadway expansion benefits.
In these and other ways these studies tend to overestimate congestion costs. The graph below adjusts the Urban Mobility Report and Global Traffic Scorecard to reflect recommended best practices. This suggests that congestion cost studies typically overestimate congestion costs by an order of magnitude compared with travellers’ willingness to pay for small time savings, so if a study estimates that annual congestion costs average $1,480 per motorist, the actual value is probably between $100 and $200.
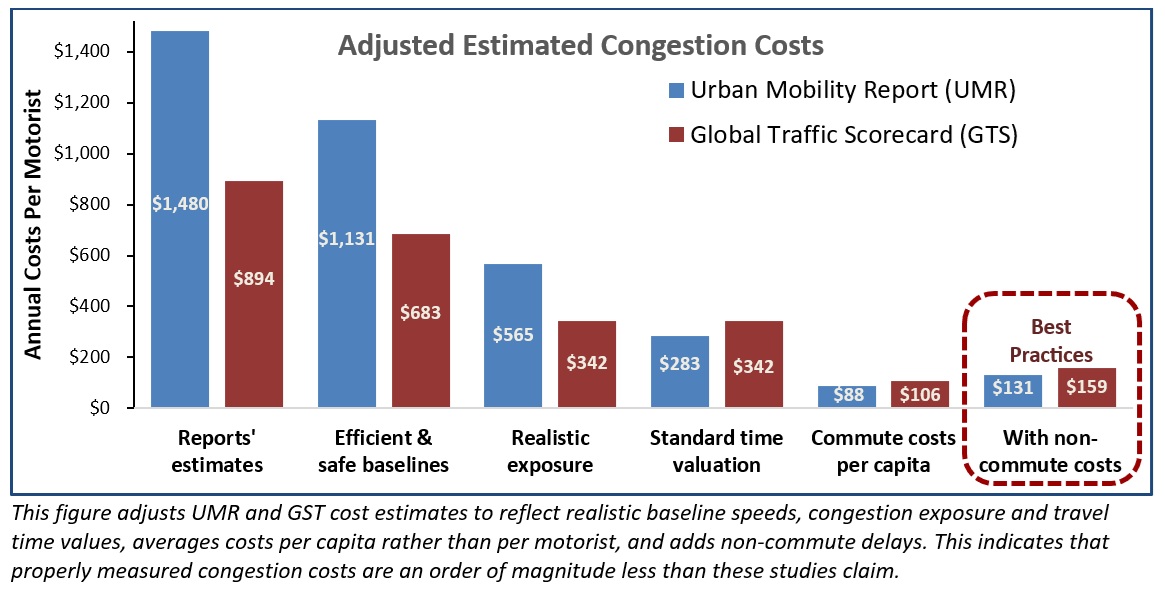 These studies are biased in other ways that favor automobile travel over other modes and therefore motorists over non-drivers. For example, they only report delays per motorist, ignoring impacts on other travellers. As a result, they only consider non-auto mode improvements beneficial to the degree they reduce motorists’ delays; benefits to non-drivers are ignored. Even worse, these studies ignore the barrier effect that wider roads and higher traffic speeds impose on walking and bicycling. As a result, they help justify urban roadway expansions that degrade walkability, and only support bus lanes that reduce automobile traffic delays — time savings to bus riders are ignored.
Similarly, by measuring impacts per motorist, these studies imply that increasing urban density increases congestion, although per capita congestion costs tend to decline because residents drive less. As a result, conventional congestion studies undervalue Smart Growth policies that create more compact, multimodal neighborhoods, and overvalue urban roadway expansions that stimulate sprawl.
These studies describe congestion as a cost that motorists bear, caused by inadequate road capacity, with the implication that drivers are the victims of underinvestment and deserve more subsidies to finance roadway expansions. However, for most planning purposes, congestion should be considered a cost that motorists impose due to the greater road space they require compared with other modes. This justifies more multimodal planning and TDM incentives, including decongestion tolls, for the sake of efficiency and fairness.
Of course, properly applied congestion cost analysis is very helpful for travellers and planners. Companies such as INRIX and TomTom emphasize high congestion costs to market their traffic data services that can help travellers avoid delays and planners evaluate congestion reduction strategies. My report identifies guides produced by major organizations such as the European Commission and the UK Department for Transport that recommend best practices which result in much lower congestion cost estimates. Planners can use this guidance to improve congestion impact analysis.
My next column will use this information to identify the most effective and beneficial congestion reduction strategies.

Congestion Costing Reality Check, Part 1: Congestion evaluation best practices
Widely cited studies claim that traffic congestion is a huge and growing problem. They exaggerate. Let’s examine how to correctly calculate congestion costs and roadway expansion benefits.
Why “Full Buses are a Car Commuter’s Dream”
Even a 5-10% drop in cars on the road can dramatically ease congestion, making healthy transit systems a win-win for transit users and drivers alike.
Study: Bus Lanes Boost Speeds for Both Buses and Cars
Dedicated transit and bike lanes can speed up traffic for everyone on busy roads.

Planetizen Federal Action Tracker
A weekly monitor of how Trump’s orders and actions are impacting planners and planning in America.
Amtrak, CN end decades-long dispute with eight-year agreement
The new operating agreement establishes an updated framework for the companies to work together, including processes to resolve disputes.

Nation's most wind-powered state turns to coal as data centers increase energy demand
For the first time in decades, Iowa has increased its generation of coal power.

Alabama scores up to $2.5 billion federal loan for largest infrastructure project in state’s history
The Mobile River Bridge and Bayway Project aims to ease congestion at Alabama’s worst bottleneck.

Trump is considering data centers on 6 states' public land — some state officials say they had no idea
If the administration approves the proposed projects, data center and data center-related developments will cover 17,600 acres of public land.

Despite court ruling, Trump is keeping nearly all wind projects in the US on hold
At least 110 wind energy projects have not heard from the government since a federal judge ruled that the Trump administration's freeze on wind turbine clearances was likely illegal.

FREE Course: Walkable City 1: Why Walkability?
After describing his path towards focusing on walkability as the essence of good planning, Jeff Speck marches through his five principal reasons for making more walkable places.
Reinventing Malls: Planning Alchemy—Turning Gray Fields Into Gold
The course focuses on the opportunities and imperatives that shape reinvention of mall sites.

KFH Group Inc.
Greater Baltimore Committee
Eagle County Government
The Architects Foundation
University of Cincinnati Online
The Pocatello Development Authority
The Urban Renewal Agency of the City of Pocatello

