


The Federal Highway Administration's National Household Travel Survey (NHTS) shows that transit use is rising and household vehicle miles traveled are declining—but other data sources paint a more ambiguous picture.


I have read (and even engaged in) much speculation about travel trends over the last few years, mostly based on year-to-year Census estimates and on transit agency ridership statistics. These data sources focus on year-to-year trends. However, another data source is the National Household Travel Survey (NHTS) [pdf]. The NHTS differs from the other sources primarily in that instead of being a yearly survey, it is conducted every five or ten years. The most recent NTHS surveys have been in 1990, 1995, 2001, 2009, and 2017. So the NHTS data doesn’t really tell us what happened in the last three or four years; instead, it gives us a longer-range perspective.
Some possible conclusions from NHTS data include the following:
- The percentage of carless households has been fairly stable in recent decades. The percentage of households without a vehicle was 15.3 percent in 1977, nosedived to 8.1 percent in 1995 and 2001, and increased to 8.7 percent in 2009 and 8.9 percent in 2017 (Table 19). This pattern seems almost identical to Census Bureau American Community Survey (ACS) data. While NHTS data shows a tiny increase in the number of carless households, ACS data shows an even tinier decrease (from 8.9 in 2010 to 8.8 in 2017).
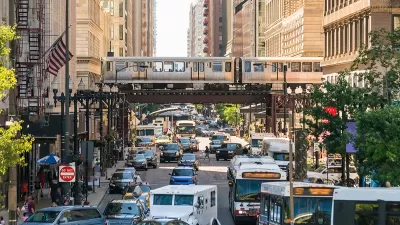
- The NHTS survey suggests that transit use actually jumped quite a bit between 2009 and 2017. Every survey between 1983 and 2009 showed that between 5.1 and 5.3 percent of survey respondents usually commuted by public transit. But the 2017 survey shows a startling (to me) jump to 6.9 percent of respondents (Table 25). I note, however, that ACS data does not show such a large increase. Instead, 4.9 percent of ACS respondents used public transit in 2010 and 5.1 percent in 2017.
- American commutes are longer than ever. The average car commute was 9.6 miles in 1977 and is 12.7 miles today. The average public transit commute was 7.5 miles then and is 12 miles today. However, commute lengths have not significantly increased since 2001 (Table 27).
- Defenders of sprawl might claim that the growth of high-speed freeways means that our commutes take less time. But in fact, our commutes take more time than ever. The average car commute was 19 minutes in 1977, 22.5 minutes in 2001, and 25 minutes in 2017. The average transit commute was 37.6 minutes in 2001 and 58.1 minutes today (Id). One possible conclusion is that job sprawl has led to longer commutes for everyone, which in turn is especially burdensome for public transit commuters due to the slow pace of suburban buses.*
- However, some drivers may be cutting down on non-commute trips. The average driver spent 71.9 minutes in their car in 1991 and 81.3 in 2001—but only 76.3 in 2009 and 78.9 in 2017 (Table 15).
- Young people in metropolitan areas apparently drive less than they used to. Daily vehicle miles traveled (VMT) by persons aged 16-24 in urban areas peaked at 20.9 per capita in 2001, nosedived to 14.6 in 2009, and stayed at that level in 2017- roughly a 30 percent decrease. By contrast, persons over 45 drove 25 miles per capita in 2001 and 22.3 in 2017—only about a 10 percent decrease. By contrast, rural young Americans behaved like older Americans in metropolitan areas; they drove 28.2 miles per capita in 2001 and 24.6 in 2017, about a 13 percent decrease (Table 33). Persons over 65 also did not change their behavior over time; their per capita VMT shifted from 21.1 in 2001 to 20.2 in 2017, a statistically insignificant decrease (Table 31). This data seems inconsistent with other data showing an overall increase in VMT. Perhaps decreases in household VMT are canceled out by increases in VMT from other sources such as commercial trucking.
- Uber and Lyft serve a wide variety of customers, but do disproportionately serve non-drivers to some extent. On the one hand, only 12.3 percent of TNC users have no car available; on the other hand, that percentage is higher than the percentage among non-TNC users (6 percent). (Table 36)
On balance, the NHTS shows very little change over the 2000s. The average American household may drive a little less and take public transit a little more than 2001—but these trends are not as overwhelming as the contrary trends of the late 20th century.
*Having said that, the NHTS data are based on average rather than median commutes, which means that the growth of long-distance commuting may artificially skew results for both cars and public transit. For example, if 9 of 10 commuters have the same commutes they had in 2001, but then 10th has a much longer commute, median commute times will be identical while the average will increase.

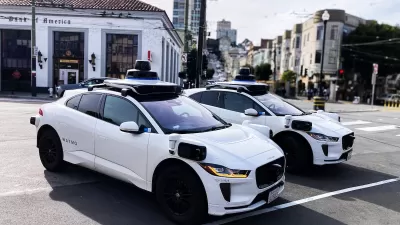
How Autonomous Cars Can Induce Sprawl and Sabotage Climate Goals
Robotaxis can lead to longer, more frequent trips and are projected to increase VMT by as much as 83 percent.

Opinion: Why Linking Driving to GDP Misses the Point
The argument that car-centric development is good because it boosts national GDP ignores the massive costs of driving to everyday Americans.
Planning for Congestion Relief
The third and final installment of Planetizen's examination of the role of the planning profession in both perpetuating and solving traffic congestion.

Planetizen Federal Action Tracker
A weekly monitor of how Trump’s orders and actions are impacting planners and planning in America.

Maui's Vacation Rental Debate Turns Ugly
Verbal attacks, misinformation campaigns and fistfights plague a high-stakes debate to convert thousands of vacation rentals into long-term housing.

Cuomo Is the Candidate of Both NIMBYs and Developers. What Gives?
In the New York City mayoral race, odd bedfellows align to preserve the housing status quo.

San Antonio and Austin are Fusing Into one Massive Megaregion
The region spanning the two central Texas cities is growing fast, posing challenges for local infrastructure and water supplies.

Charlottesville Temporarily Has No Zoning Code
A judge ordered the Virginia city to throw out its newly revised zoning code, leaving permitting for new development in legal limbo.

In California Battle of Housing vs. Environment, Housing Just Won
A new state law significantly limits the power of CEQA, an environmental review law that served as a powerful tool for blocking new development.
Urban Design for Planners 1: Software Tools
This six-course series explores essential urban design concepts using open source software and equips planners with the tools they need to participate fully in the urban design process.
Planning for Universal Design
Learn the tools for implementing Universal Design in planning regulations.
Heyer Gruel & Associates PA
JM Goldson LLC
Custer County Colorado
City of Camden Redevelopment Agency
City of Astoria
Transportation Research & Education Center (TREC) at Portland State University
Jefferson Parish Government
Camden Redevelopment Agency
City of Claremont