


Thirty years after a seminal study attempted to connect increased density with decreased automobile use, several new studies are raising doubts about that central assumption of contemporary planning.
Recent research sheds new light on the critical issue of the link between car travel and urban density. Conventional planning wisdom has it that increasing development density bestows benefits, most importantly that of reducing driving. This effect seems almost self-evident: more compaction, shorter distances, lower VMTs, it’s often argued. Newman and Kenworthy reinforced this intuitive assumption with their extensive and in-depth study (1986), which effectively sealed the case for thirty years. But recent research, in tandem with results from actual developments, shows that this relationship is complex and the study etched it imperfectly. We extract and connect findings from three studies to show that our understanding of what induces, or reduces, driving is incomplete—common sense is insufficient.
These three works cover the gamut of geography: from international cities to U.S. urbanized areas to 60,000 census tracts and to specific community developments. In these works, we look at findings that relating specifically to the question of density and its association to commuting by car. This geographic range allows assumptions to be tested at all levels (theory to practice) and all scales (regional to local).
Expected Differences and a Surprising Similarity
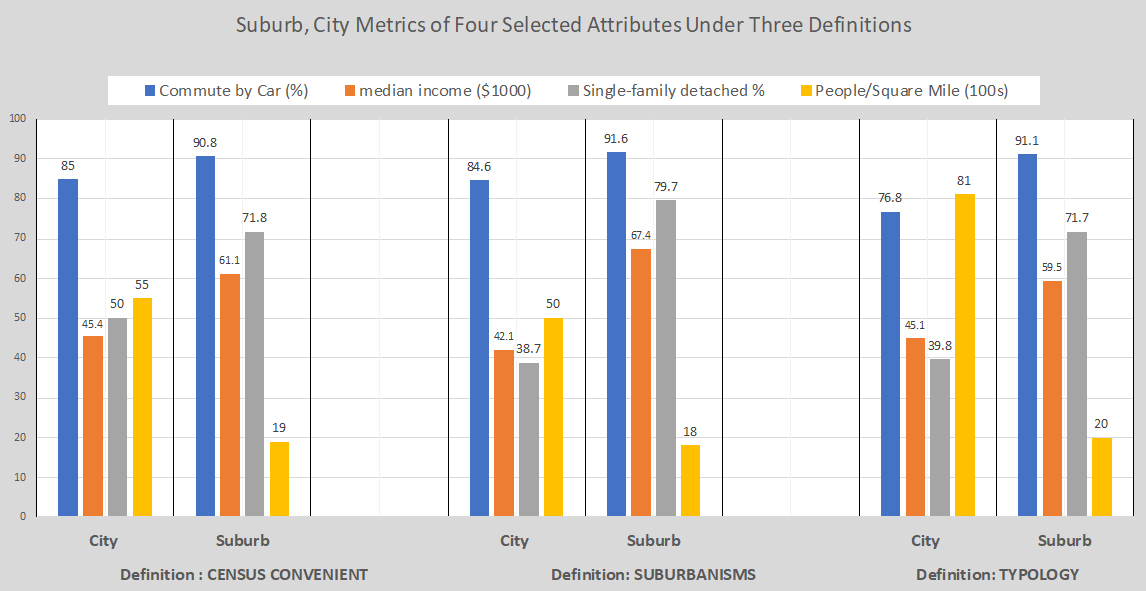
A paper by the Joint Center for Housing Studies of Harvard University sets out to determine how three distinct definitions of "city" and "suburb" affect the outcomes of analyses and, ultimately, the quantitative representation of their characteristics. It offers an opportunity to examine any one of 29 characteristics (covering economic, socio-demographic and physical) using a large statistical base. Figure 1 shows this intent with a subset of only four characteristics. For example, "city" density (yellow) varies between 5,000 to 8,100 people per square mile under the respective definitions. By contrast, "suburban" density varies less: from 1,800 to 2000 people per square mile. The large (60%) difference in "city" density between the first two and third definition is surprising but explainable in that "city" in this definition represent the city core only, usually small in area and very dense.
Differences between "city" and "suburb" within a definition (e.g., Census Convenient) for some characteristics are pronounced and, in most cases, expected. For example, Median Income ($45,00 vs $61,100) and percent of Single-Family Detached (50% vs 71.8%) offer no surprises. The surprise, and the first signpost in our travel, appears in the rate of Commute-by-Car. This counterintuitive statistic becomes clearer in Fig 2.
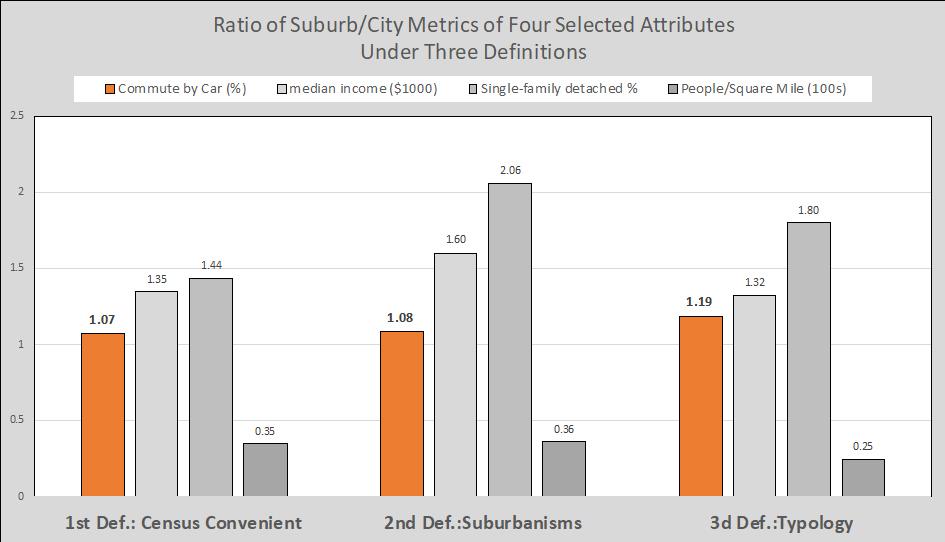
Figure 2 shows the ratios of city to suburb metrics for the same four characteristics under the three definitions. For 27 of 29 characteristics, across all definitions, examined in the study, the lowest ratio between city and suburb is for "Commuting-by-Car." No matter how you define these two distinct built environments, commuting by car varies little between cities and suburbs. The noticeable difference (1.19 ratio) in the third definition is easily understood by the limited geographic delineation of "city" in it—only its core ( about a fifth of the metropolitan tracts).
These findings are surprising and remarkable, because they raise doubts about the reflexive perception that "city" residents commute far less by car than their suburban counterparts, and that such an outcome is due to increased density. There is good reason to explore how this perception was shaped.
Apples and Oranges
It is not unusual to find rational explanations for why potential variables or suspected confounders have been excluded from research, particularly in studies that carry no measurable practical risks. In such studies, the universe of interrogation is sharply circumscribed, the parameters chosen, and the method impregnable.
Except that such variables and confounders could explain incongruous outcomes, should they be considered: "We find that density alone explains only a small fraction of the variation in vehicle miles traveled (VMT), and many confounders account for the differences in automobile dependence." This central finding appears in the Ewing at al paper "Testing Newman and Kenworthy’s Theory of Density and Automobile Dependence" (2017) commenting on the subject author’s 1989 study.
This 30-year inattention to a sub-set of travel-inducing factors started with a pioneering data collection effort, a thoroughly convincing study and an irresistibly elegant exponential curve, which has been indelibly etched in planners’ minds and in multiple sources. Figure 3 depicts an attempt to show its problematic, apples-and-oranges nature by deconstructing it.
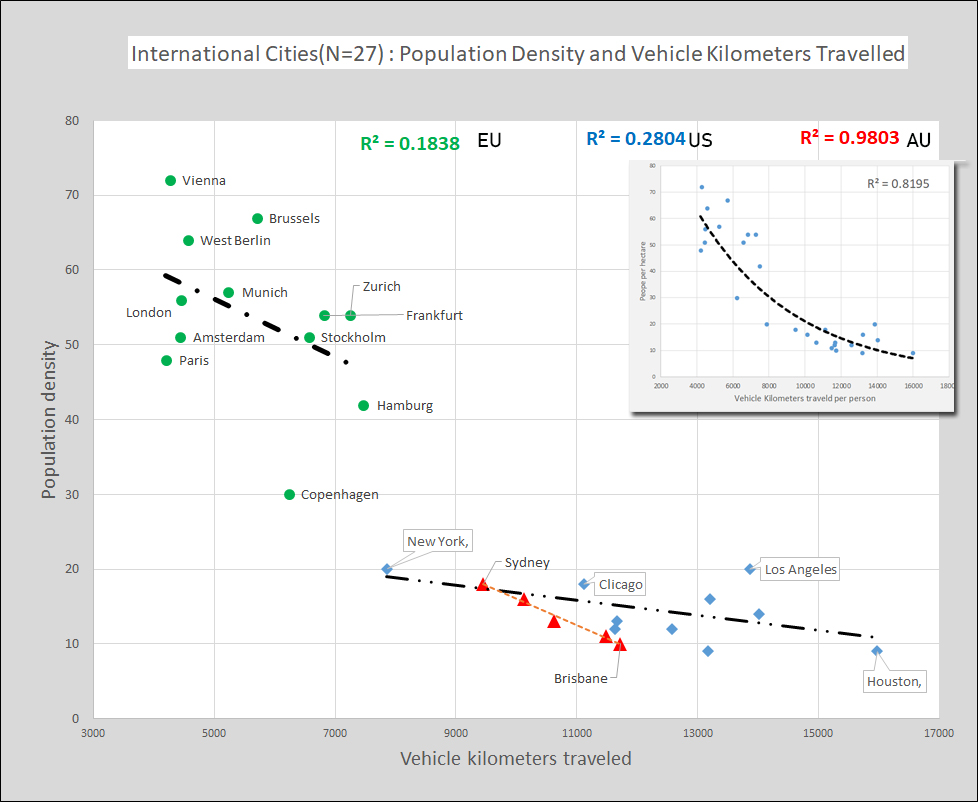
The composite exponential curve (Fig. 3, in box) for 27 cities shows a strong correlation with an impressive R2 = 0.8195. However, when deconstructed, its component elements vary substantially in strength from an R2 = 0.1838 for European cities, an R2 = 0.2804 for U.S. cities, and a remarkable R2 = 0.9803 for Australian cities—a hard-to-explain variability based on density alone. It is worth noting that the U.S. cities correlation becomes insignificant (R2= 0.0775) without New York, the outlier. Puzzling too are the differences among European cities. Copenhagen, for example, has only 60% of Stockholm’s density and less than 50% Brussels’ density, yet it registers nearly identical vehicle kilometers traveled (VKTs). Similarly, across groups, New York has half the density of Hamburg, yet both register similar VKTs. Clearly, other factors lurk behind the overall correlation. "This suggests an apples and oranges problem in the dataset," say the authors of the above-mentioned paper. Digging further into the available data, my analysis attempted to examine whether structural differences of key geographic city components had an easy-to-discern association with travel.
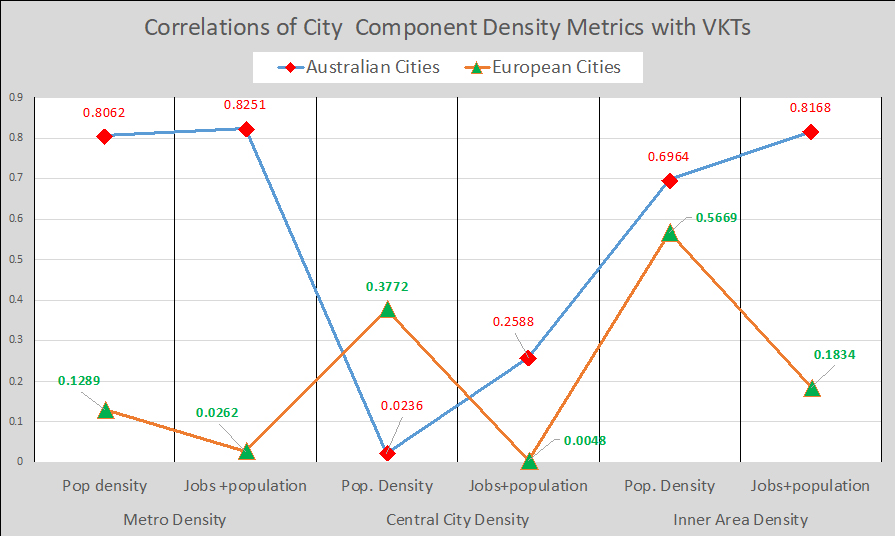
The image that emerges (Fig. 4) further complicates our pursuit of land use factors that induce travel. For example, jobs+population in Central City (i.e., land use intensity) bears no association to travel (R2= 0.0048) for European cities and a weak one (R2 =2588) for Australian cities. A similar divergence emerges in the land use intensity of the Inner Area: a weak relationship for E.U. cities (R2=0.1834) and a very strong one (R2=0.8168) for Australian cities. Such correlations confound the common perception that Jobs+Density can be a strong positive vector in shaping travel—another question mark.

Traces on the Ground
Moving to the scale of individual developments, many projects in the United States and Canada were intentionally designed to be compact and walkable to reduce car use. Tomalty and Heider (2009) carefully selected four such Canadian projects and compared them with four conventional subdivisions in a detailed, thorough study.
The comparison of their physical attributes finds a substantial difference in housing unit density—74% higher in the compact/walkable set, consistent with their intent. Yet, as shown in Fig. 5, the difference in total VKTs between the two sets is insignificant (10,670 vs 10,340). The total car trips and the trips per household, on the other hand, vary noticeably, but the difference mirrors almost exactly the average persons per households in the sets (ratio 1.2)—more people, more trips. This comparison of built communities confirms the second significant finding of the Ewing et al. paper: "[…]We also find that it is not the localized density of individual neighborhoods that causes VMT to be lower in compact urbanized areas but rather the relative accessibility of neighborhoods to the rest of the region." This ground test subverts the belief that density is the key factor in predicting car travel.
Travel Log and Lessons
This excursion visited three studies that cover the gamut of geographic scales and a 30-year span of research. Their outcomes, directly or indirectly, speak to the role that population density plays in reducing car travel, suggesting that it would be a misrepresentation to portray density as a central vector in determining car travel. Other factors, and there are many, singly or collectively, can have an equal or higher influence on travel outcomes.
Promoting the conviction that simply increasing the density of sporadic developments in a metropolitan region will achieve a reduction in travel is ill-founded. Travel seems strongly entangled not only with moldable physical attributes, such as density and land use, but also, importantly, with intractable factors, such as personal income, status, perceptions of freedom, household size, employment choice, and stage in life, to name a few. Usually bypassed, such factors, though they lie outside the realm of planning policy, could still inform planning in general by circumscribing its limits and by uncovering unforeseen opportunities.
-------------
Note: This article owes much of its clarity to the indefatigable efforts of the Managing Editor James Brasuell.
Fanis Grammenos is the director Urban Pattern Associates in Ottawa, Ontario and the author of Remaking the City Grid: A Model for Urban and Suburban Development. Reach him by email with questions or comments.
References:
- Reid Ewing, Shima Hamidi, Guang Tian, David Proffitt (2016):Testing Newman and Kenworthy’s Theory of Density and Automobile Dependence
- Whitney Airgood-Obrycki and Shannon Rieger (2019)Defining Suburbs: How Definitions Shape the Suburban Landscape
- Murtaza Heider, Ph.D.and Ray Tomalty Ph.D:COMPARING CANADIAN NEW URBANIST AND CONVENTIONAL SUBURBAN NEIGHBOURHOODS, Research Report, 2009 CMHC
- Jeffrey R. Kenworthy, Felix B. Laube: Patterns of automobile dependence in cities: an international overview of key physical and economic dimensions with some implications for urban policy, Institute for Science and Technology Policy, Murdoch University.

Study: Self Driving Cars Could Worsen Congestion and Inequality
It's not all free flowing commutes and world peace in an autonomous vehicle-filled future.
Report: Americans Are Driving More Than Ever
Average vehicle miles driven rose in almost every major metropolitan area between 2019 and 2024.

Planning for Accessibility: Proximity is More Important than Mobility
Accessibility-based planning minimizes the distance that people must travel to reach desired services and activities. Measured this way, increased density can provide more total benefits than increased speeds.

Planetizen Federal Action Tracker
A weekly monitor of how Trump’s orders and actions are impacting planners and planning in America.

Restaurant Patios Were a Pandemic Win — Why Were They so Hard to Keep?
Social distancing requirements and changes in travel patterns prompted cities to pilot new uses for street and sidewalk space. Then it got complicated.

Map: Where Senate Republicans Want to Sell Your Public Lands
For public land advocates, the Senate Republicans’ proposal to sell millions of acres of public land in the West is “the biggest fight of their careers.”

Maui's Vacation Rental Debate Turns Ugly
Verbal attacks, misinformation campaigns and fistfights plague a high-stakes debate to convert thousands of vacation rentals into long-term housing.

San Francisco Suspends Traffic Calming Amidst Record Deaths
Citing “a challenging fiscal landscape,” the city will cease the program on the heels of 42 traffic deaths, including 24 pedestrians.

California Homeless Arrests, Citations Spike After Ruling
An investigation reveals that anti-homeless actions increased up to 500% after Grants Pass v. Johnson — even in cities claiming no policy change.
Urban Design for Planners 1: Software Tools
This six-course series explores essential urban design concepts using open source software and equips planners with the tools they need to participate fully in the urban design process.
Planning for Universal Design
Learn the tools for implementing Universal Design in planning regulations.
Heyer Gruel & Associates PA
JM Goldson LLC
Custer County Colorado
City of Camden Redevelopment Agency
City of Astoria
Transportation Research & Education Center (TREC) at Portland State University
Camden Redevelopment Agency
City of Claremont
Municipality of Princeton (NJ)