


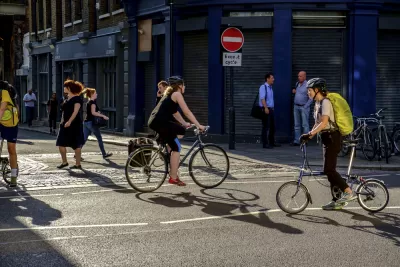
What role can active and micro modes (walking, bicycling, e-bikes and their variants) play in reducing emissions? Far more than most current emission reduction plans will achieve. We can do better!

My recent Planetizen column, Comprehensive Transportation Emission Reduction Planning, identifies various factors to consider when developing emission reduction plans, such as embodied emissions, rebound effects and comprehensive impact analysis. It concluded that most emission reduction plans overinvest in vehicle electrification and underinvest in vehicle travel reduction strategies compared with what is fair and efficient.
Next month I will present a paper at the Transportation Research Board annual meeting, Evaluating Active and Micro Mode Emission Reduction Potentials, that applies this analysis to active and micro modes. It finds that most emission reduction plans significantly underinvest in walking, bicycling and micro modes compared with what is optimal.
Let me summarize my key findings.
Active Mode Travel Demands
A key issue in this analysis is the demand for active travel: the amount that people would use these modes and the factors that affect this. According to commonly-cited census data, active modes serve less than 4 percent of commute trips and less than 2 percent of travel distance. This implies that active modes are unimportant and even large increases in their use could only provide small vehicle travel and emissions reductions. However, more comprehensive data, such as the National Household Travel Survey, indicate that active modes serve 10-15 percent of total trips.
There is also significant latent demand. Many studies find that appropriate improvements in infrastructure and safety significantly increase walking, bicycling and micro mode travel. For example, after the Federal Highway Administration’s four-year Nonmotorized Transportation Pilot Program invested about $100 per capita in pedestrian and bicycling improvements in four typical communities, walking trips increased 23 percent, bicycling trips increased 48 percent, and automobile travel declined 3 percent. A recent U.S. study found that a 10 percent increase in per capita bikeway-miles increases bicycle commute mode shares 2.5 percent, and a 10 percent increase in protected bicycle lanes increases bicycle mode shares 4 percent. Cities with extensive active mode networks, such has Davis, CA, Eugene, OR and Boulder, CO have more than 15 percent active commute mode shares, five times the national average, plus under 20 daily vehicle miles travelled per capita, 20 percent less than the national average.
Active mode improvements can have leverage effects, so each additional mile of active travel reduces more than one vehicle-mile, in ways summarized below.
Common Active Transportation Leverage Effects
|
1. Fair Share Planning and Consumer Sovereignty
Fair share planning strives to give each traveller a comparable share of public resource unless additional subsidies are justified for specific reasons. This implies that active modes should receive investments at least comparable to their share of trips or portion of travellers who depend on them, and more if needed to make up for past underinvestment. Consumer sovereignty means that transportation planning responds to changing demands. This implies that active mode investments should increase if demand for their use increases, for example, due to rising poverty, health and environmental concerns, or if increased micro mode traffic requires larger sidewalks, bikelanes and paths.
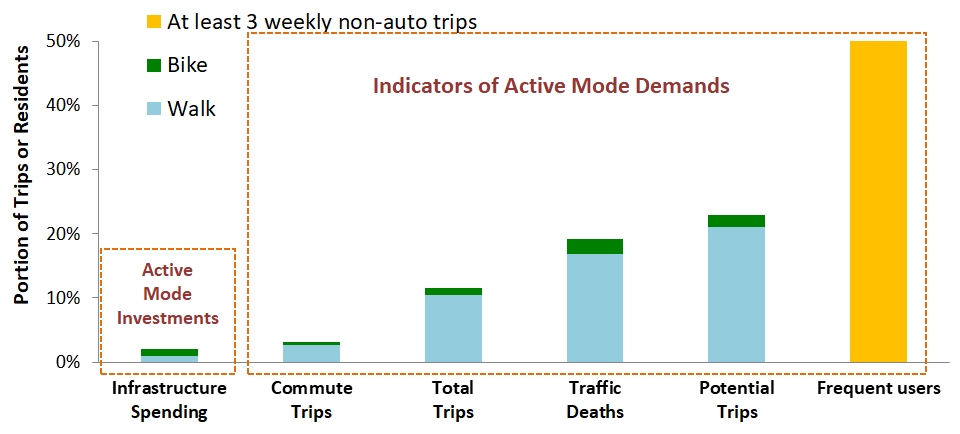
Most communities currently spend $50 to $100 per capita on sidewalks and bicycling facilities. Detailed studies estimate that improving all sidewalks to optimum standards in typical North American cities, such as Albuquerque, New Mexico and Denver, Colorado, would cost between $5 and $50 annually per capita. Washington State’s Active Transportation Plan estimates that upgrading the state transportation system to maximize active travel safety would cost $5.7 billion, averaging approximately $40 annually per capita over 20 years. Such investments are small compared with the $800 annual per capita expenditures on public roads, $200 on traffic services, and $2,000 or more on government-mandated off-street parking. The figure below compares estimated active mode infrastructure expenditures with indicators of their demand, including mode share, traffic deaths, potential trips, or frequent users (people who make at least three weekly non-auto trips).
Active Mode Infrastructure Spending Versus Demand Indicators
2. Social Equity
Social equity goals means that planning favors investments that benefit disadvantaged groups. Since active modes provide basic mobility to people with disabilities and low incomes, social equity goals justify investments in those modes, particularly universal design policies that benefit people with disabilities and improvements serving disadvantaged communities.
3. Cost Effectiveness
Cost efficiency planning invests in facilities and services that maximize net benefits, taking into account all impacts. This implies that communities should invest in active modes whenever they cost less than automobile facilities that serve the same trips, or have benefit/cost ratios higher than other investments. Since active modes have low facility costs and provide many benefits, this tends to justify more investments in these modes. However, conventional transportation planning tends to ignore many of these impacts. For example, although active mode improvements help reduce vehicle ownership and use, transportation project evaluation seldom accounts for vehicle cost savings, road and parking facility cost savings, or traffic congestion reduction benefits provided by active mode improvements.
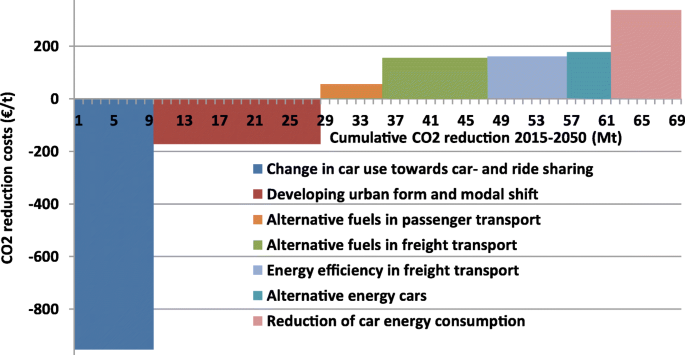
Some studies estimate and compare unit costs of various emission reduction strategies, measured as dollars per metric tonne of emissions reduced. These studies vary widely in their methods and assumptions. Most only consider direct implementation costs, but a few also consider indirect costs and co-benefits. These studies often find that active mode improvements are among the most cost effective emission reduction strategies, with benefits that far exceed their total costs. For example, the study CO2 Reduction Costs and Benefits in Transport: Socio-technical Scenarios, concluded that shifting car travel to shared modes and more compact urban development provide significant net savings, while alternative fuel cars cost 175€ to 300€ per tonne of emission CO2 reduced, as illustrated below.
4. Strategic Objectives
Strategic objectives means that individual, short term decisions should support long-term goals. Active mode improvements tend to provide a wider range of benefits than many other transportation emission reduction strategies. When all impacts are considered, they are often among the most cost effective and beneficial ways of reducing emissions.
Emission Reduction Plans Reviewed
Below are conclusions based on a review of more than two dozen typical emission reduction plans by various governments and organizations:
- Most plans use simplified analysis: most ignore embodied emissions, rebound effects, leverage effects, and vehicle travel reduction co-benefits. These biases tend to exaggerate clean vehicle benefits, and undervalue vehicle travel reduction strategies including active and micro modes.
- Most invest primarily in clean vehicle strategies, with few investments in vehicle travel reduction strategies, particularly active mode improvements and incentives. Although most provide large electric vehicle subsidies, few provide micro mode subsidies.
- Some plans, such as those by the National Academy of Sciences and the International Energy Agency, imply that vehicle travel reductions are costly and difficult to achieve, and only provide small emission reductions, and so give minimal support to active mode investments.
- Sustainable development organizations such as the World Resources Institute and the United Nations Environmental Programme, give more priority to vehicle travel reductions, and consider a wider range of impacts, and so give significant support for active mode investments.
- Some jurisdictions, including California, New Zealand, and the United Kingdom, have vehicle travel reduction targets; they typically want to reduce motor vehicle travel 15-25 percent during the next two decades, and approximately double active and public transport travel. Some have analysis tools and policies to ensure that individual planning decisions support these targets.
- Few current plans are likely to achieve emission reduction targets.
This suggests that many emission reduction plans are biased in ways that exaggerate clean vehicle benefits and undervalue active and micro modes. More comprehensive analysis can justify significantly more investments in active modes.
Conclusions and Recommendations
This study finds that most transportation emission reduction plans are biased in ways that tend to exaggerate electric vehicle benefits and undervalue active modes. They assume that active modes can provide only tiny emission reductions, and they overlook the co-benefits that result when travelers drive less and rely more on non-auto modes. This results in underinvestment in active modes compared with what is optimal.
Although commonly-cited statistics imply that active modes serve less than 2 percent of travel, more comprehensive analysis indicates that they actually serve 10-15 percent of trips, have significant and growing latent demand, often leverage additional vehicle travel reductions, and provide large and diverse benefits. Active mode improvements support other vehicle travel reduction strategies such as public transit encouragement and compact community development.
Comprehensive analysis can justify much more investments in active modes. Currently, most jurisdictions spend less than 4 percent of their transportation infrastructure budgets on active modes. At a minimum, they should receive funding and road space equivalent to their potential mode shares, typically 15-30 percent of trips, and more to make up for past underinvestment. Active mode improvements should be implemented as part of integrated programs that also include public transport improvements, TDM incentives and Smart Growth development policies. These would provide large emission reductions plus other economic, social and environmental benefits.
Optimizing active travel requires a variety of planning reforms. For the last century, planning has prioritized travel speed over other goals such as affordability, health and safety, and environmental quality. More efficient and equitable transportation requires reprioritization. A useful approach is to establish vehicle travel reduction targets, typically 15-25 percent reductions in per capita vehicle-travel, and develop analysis tools and policies to incorporate these goals in all planning decisions. Active mode improvements are essential to achieving these targets.
For More Information
Torsha Bhattacharya, Kevin Mills, and Tiffany Mulally (2019), Active Transportation Transforms America: The Case for Increased Public Investment, Rails-to-Trails Conservancy.
Christian Brand, et al. (2021), “The Climate Change Mitigation Effects of Daily Active Travel in Cities,” Transportation Research D, Vo. 93.
Knight Frank (2020), Walkability and Mixed Use - Making Valuable and Healthy Communities, The Prince’s Foundation.
Todd Litman (2021), Evaluating Active Transport Benefits and Costs, Victoria Transport Policy Institute.
Todd Litman (2022), Fair Share Transportation Planning: Estimating Non-Auto Travel Demands and Optimal Infrastructure Investments, Victoria Transport Policy Institute.
Todd Litman (2023), Comprehensive Transportation Emission Reduction Planning, Planetizen
Todd Litman (2023), Evaluating Active and Micro Mode Emission Reduction Potentials, Transportation Research Board Annual Meeting.
Michael McQueen, John MacArthur and Christopher Cherry (2020), “The E-Bike Potential: Estimating Regional E-bike Impacts on Greenhouse Gas Emissions,” Transportation Res. D, Vo. 87.
D. Taylor Reich, et al. (2022), Protected Bicycle Lanes Protect the Climate, Institute for Transportation and Development Policy.
Qiyao Yang, et al. (2021), “Bikeway Provision and Bicycle Commuting: City-Level Empirical Findings from the US,” Sustainability, Vo. 13.

California Environmental Leaders Call on State Agencies to Prioritize Multimodal Transportation
Even before President Trump took office, California was not meeting its emissions reduction goals.

Denver Micromobility on Track to Break Ridership Record
Denver’s shared bikes and scooters will provide as many as 6 million rides in 2024.
DC Micromobility Use Keeps Growing
Capital Bikeshare saw its fourth straight month of record ridership.

Planetizen Federal Action Tracker
A weekly monitor of how Trump’s orders and actions are impacting planners and planning in America.

Maui's Vacation Rental Debate Turns Ugly
Verbal attacks, misinformation campaigns and fistfights plague a high-stakes debate to convert thousands of vacation rentals into long-term housing.

Restaurant Patios Were a Pandemic Win — Why Were They so Hard to Keep?
Social distancing requirements and changes in travel patterns prompted cities to pilot new uses for street and sidewalk space. Then it got complicated.

In California Battle of Housing vs. Environment, Housing Just Won
A new state law significantly limits the power of CEQA, an environmental review law that served as a powerful tool for blocking new development.

Boulder Eliminates Parking Minimums Citywide
Officials estimate the cost of building a single underground parking space at up to $100,000.

Orange County, Florida Adopts Largest US “Sprawl Repair” Code
The ‘Orange Code’ seeks to rectify decades of sprawl-inducing, car-oriented development.
Urban Design for Planners 1: Software Tools
This six-course series explores essential urban design concepts using open source software and equips planners with the tools they need to participate fully in the urban design process.
Planning for Universal Design
Learn the tools for implementing Universal Design in planning regulations.
Heyer Gruel & Associates PA
JM Goldson LLC
Custer County Colorado
City of Camden Redevelopment Agency
City of Astoria
Transportation Research & Education Center (TREC) at Portland State University
Jefferson Parish Government
Camden Redevelopment Agency
City of Claremont