


Many jurisdictions have vehicle travel reduction targets. Integrated Smart Growth policies can help achieve these and other planning goals.


Many jurisdictions have targets to reduce vehicle miles of travel (VMT) and increase use of alternative modes (walking, cycling, public transit, etc.) in order to reduce emissions and achieve other economic, social, and environmental goals. For example, California law requires that per capita vehicle travel be reduced 15% by 2050, Washington State has even more ambitious targets, to reduce per capita VMT 25% below by 2035 and 50% by 2050, and many cities have VMT reduction targets. California [pdf] requires local governments to support more compact, Smart Growth development in order to reduce motor vehicle travel and emissions. Guides are now available for designing and evaluating vehicle travel reduction plans.
These plans are sometime criticized, as discussed in my report, "Are Vehicle Travel Reduction Targets Justified?" [pdf] Critics argue that vehicle travel reductions must harm consumers and reduce economic productivity, but as discussed in my report, although few motorists want to forego driving altogether, surveys indicate that many would prefer to drive less and rely more on other transport options, provided they are convenient, comfortable and affordable. Similarly, with better logistics and incentives, businesses could become more productive with less vehicle travel, for example, by shifting freight from truck to rail, and with more efficient pricing which reduces their traffic and parking congestion, and infrastructure costs.
There are also debates concerning the effectiveness of some VMT reduction strategies. For example, a recent Planetizen blog, "Three Studies That Show Density Doesn't Determine Car Travel," by Fanis Grammenos, is apparently intended to suggest that by itself, increasing development density is ineffective at reducing vehicle travel. There is a kernel of truth in this claim, but the blog severely misrepresents the issues. Grammenos cherry-picks studies, some many years old, indicating that density is just one of many land use factors that affect car ownership and use. This is true, but in no way reduces the justification for policy reforms that create more compact and multi-modal communities.
Density is only one of many land use factors affecting vehicle travel, and not necessarily the most important. For example, residents of high-rises in isolated, automobile-dependent location tend to drive a lot, and conversely, residents of small towns and rural villages tend to drive less low population densities measured at a county or regional scale. However, density confounds with other factors that tend to reduce automobile travel such as land use mix, walkability, transit accessibility, reduced parking supply and increased parking pricing, to name a few. Since density is relatively easy to measure, it is often used as a surrogate for other urban factors. This is not news: planners and modellers know that many factors affect travel activity and use this information to design more accessible and multi-modal communities. The table below summarizes how various land use factors affect travel activity.
Land Use Impacts on Travel Summary [pdf]
Factor |
Travel Impacts |
|
Density. People or jobs per unit of land area (acre or hectare). |
Reduces vehicle ownership and travel, and increases use of alternative modes. A 10% increase typically reduces VMT 0.5-1% as an isolated factor, and 1-4% including associated factors (regional accessibility, mix, etc.). |
|
Regional accessibility. Location of development relative to regional urban center. |
Reduces per capita vehicle mileage. More central area residents typically drive 10-40% less than at the urban fringe. |
|
Development mix. Proximity between different land uses (housing, commercial, institutional) |
Tends to reduce vehicle travel and increase use of alternative modes, particularly walking. Mixed-use areas typically have 5-15% less vehicle travel. |
|
Centeredness (centricity). Portion of jobs and other activities in central activity centers (e.g., downtowns) |
Increases use of alternative modes. Typically 30-60% of commuters to major commercial centers use alternative modes compared with 5-15% at dispersed locations |
|
Network Connectivity. Degree that walkways and roads are connected |
Increased roadway connectivity can reduce vehicle travel and improved walkway connectivity increases non-motorized travel |
|
Roadway design. Scale, design and management of streets. |
Complete, multi-modal streets increase use of alternative modes. Traffic calming reduces VMT and increases non-motorized travel |
|
Active transport (walking and cycling) conditions. Quantity, quality and security of sidewalks, crosswalks, paths, and bike lanes. |
Improved walking and cycling conditions tends to increase nonmotorized travel and reduce automobile travel. Residents of more walkable communities typically walk 2-4 times more and drive 5-15% less than in more automobile-dependent areas. |
|
Transit quality and accessibility. Quality of transit service and access from transit to destinations. |
Increases ridership and reduces automobile trips. Residents of transit oriented neighborhoods tend to own 10-30% fewer vehicles, drive 10-30% fewer miles, and use alternative modes 2-10 times more than in automobile-oriented areas. |
|
Parking supply and management. Number of parking spaces per building unit or acre, and how parking is managed and priced. |
Tends to reduce vehicle ownership and use, and increase use of alternative modes. Cost-recovery pricing (users finance parking facilities) typically reduces automobile trips 10-30%. |
|
Site design. Whether buildings are oriented for auto or multi-modal accessibility. |
More multi-modal site design can reduce automobile trips, particularly if implemented with improvements to other modes. |
|
TDM programs. Various programs that encourage more efficient travel activity, such as commute trip reduction and campus transport management. |
Tends to reduce vehicle ownership and use, and increase use of alternative modes. Impacts vary depending on specific factors. |
This table describes various land use factors that can affect travel behavior.
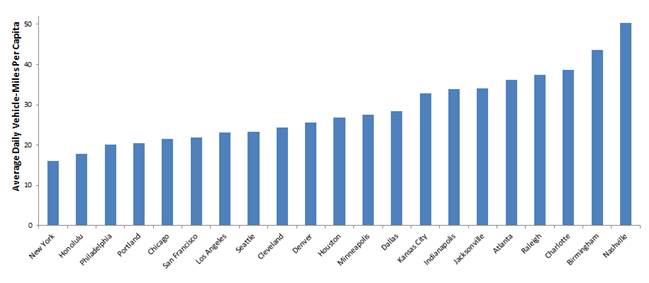
Let's put this into perspective using data from Table HM-72 of the FHWA's Highway Statistics report. The figure below compares average daily vehicle-miles per capita for various U.S. urban regions. This shows significant variations: residents of Charlotte, Birmingham and Nashville drive more than twice as much as residents in Honolulu, Philadelphia and Portland. What explains these differences? It certainly is not wealth or productivity: most high-mileage regions are much poorer than most low-mileage urban regions. It is not simply personal preferences, since many people reduce their vehicle-travel if they move to low vehicle-travel cities or increase their vehicle travel if they move to high-mileage cities.
Per Capita Vehicle Travel in Selected Urban Regions
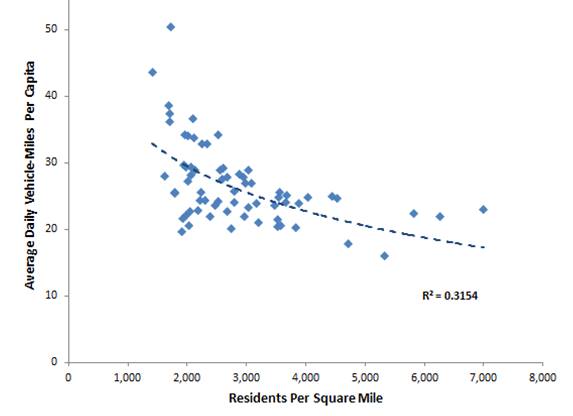
The figure below shows the relationship between regional density and per capita vehicle travel from the same dataset. It shows a strong inverse relationship between density and mileage. Of course, other factors also affect vehicle travel, such as land use mix, neighborhood walkability, roadway connectivity, public transit service quality, and parking supply, but density is clearly an important factor.
Population Density Versus Vehicle Travel in Selected Urban Regions
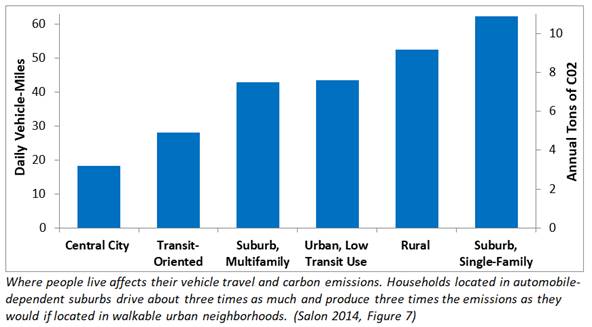
Similar patterns occur within an urban region: residents of more compact, mixed, multi-modal neighborhoods tend to drive less than demographically comparable households located in automobile-oriented, fringe areas. The report, "Quantifying the Effect of Local Government Actions on VMT" [pdf], uses sophisticated analysis of travel survey data to quantify how various land use and transport system changes would affect work and non-work travel. It found large Vehicle Miles Travelled (VMT) differences between otherwise comparable households living in different neighborhood types. Daily VMT are three times larger in the highest-VMT neighborhood type than in the lowest, as illustrated below.
Household Vehicle Travel and Emissions by Location and Housing Type
Although specific results can vary depending on analysis methods and study areas, many recent studies indicate that a combination of policy reforms that create more compact, mixed and multi-modal communities, which can significantly reduce per capita vehicle travel, and associated costs including road and parking infrastructure requirements, consumer costs, accidents and pollution emissions, as discussed in "Understanding Smart Growth Savings" [pdf]. What types of policies are effective? Below is a set of specific regional policy reforms that could achieve vehicle travel reduction goals.
Efficient and Equitable Transportation Policies
Name |
How |
Travel Impacts |
| Accelerate regional transit plan implementation |
Increase transit funding by 50-100% ($125-250 annual per capita). |
Increase transit ridership by 60% and reduce auto travel by 5-10%. |
| Improve interregional transit connections |
Coordinate planning and services among provincial and regional agencies. |
Shift 10-30% of auto travel to transit on affected corridors. |
| Improve active transportation |
Increase active transport program funding by $50-100 annual per capita. |
Approximately double active mode shares. |
| Implement Transportation Demand Management programs |
Local and regional governments can Implement TDM strategies and require TDM programs by large employers. |
Reduce affected vehicle travel 5-30% and support shifts to other modes. |
| Transit Oriented Development |
Transit improvements and local policy reforms to create compact, walkable neighborhoods along frequent transit. |
Typically reduces affected residents’ and employees’ auto travel 20-50% and increases non-auto travel. |
| Eliminate or reduce minimum parking requirements |
Local policy reforms to reduce parking requirements and more efficiently manage parking supply. |
Reduced parking supply and efficient pricing typically reduce affected vehicle trips 10-30%. |
A variety of local policies can help increase transport system efficient and equity.
These six strategies vary in the types of travel they affect. Transit improvements affect regional personal travel, active travel improvements directly affect local travel, TDM programs can affect targeted travel (commuting, freight, tourism, special events, etc.), transit-oriented development affects resident and employee travel, and parking policies can affect all types of vehicle travel. Shorter walk and bicycle trips often substitute for longer car trips, so an increase in walking or bicycling often causes a larger reduction in auto travel, for example, if children walk or bike to school rather than being chauffeured with an empty backhaul (return trip).
Many of these strategies have synergistic impacts: they become more effective if implemented together. For example, a transit improvement by itself might only reduce driving 5%, and parking pricing might reduce driving 10%, but together they reduce driving 25% by providing both positive and negative incentives to shift mode. Similarly, transit improvements attract more riders if implemented with more compact development and improved walkability around stops and destinations. An integrated set of strategies can create communities where residents reduce their vehicle ownership, and non-auto travel becomes more socially acceptable, which leverage additional vehicle travel reductions.
This issue can be viewed in two different ways which result in very different conclusions concerning how density can reduce vehicle travel. By itself, increasing density in a particular area, without increasing land use mix, connectivity, walkability, transit service quality or parking management, will provide little vehicle travel reduction: a 10% increase in urban densities typically reduces per capita vehicle travel just 2-3%. However, increasing density in accessible, multi-modal areas, such as a transit-oriented development or walkable urban neighborhoods, can substantially reduce the driving by the households who locate there, typically by 30-60%. Not every household wants to live in such areas, but housing preference surveys indicate that many households would prefer living in compact, walkable urban neighorhoods, but cannot due to a lack of supply. Increasing allowable densities in such areas, so a greater portion of households can locate there, can provide large VMT reductions.
The following policies, described in Our Affordable and Inclusive Neighbourhood Agenda, can significantly increase infill development, helping to meet this demand.
- Pre-zone more areas for multi-family housing. This reduces infill development costs, increasing moderate-priced project feasibility.
- Allow an additional story for corner lots, larger lots (at least 1,000 square meters), and on busier streets (arterials or subarterials). These are locations where taller buildings have less impact on neighbours.
- Exempt moderate-priced housing from inclusivity mandates. This encourages developers to build more moderate-price units, which directly increases affordability for moderate-income households, and for lower-income households through filtering.
- Reduce fees and approval requirements for smaller and moderate-priced infill developments, since these are the projects we most need.
- Reduce or eliminate parking requirements and require or encourage unbundling (parking rented separately from housing units), so residents are not forced to pay for parking spaces they do not need. Many cities are doing this now to increase affordability, allow more compact development and reduce traffic problems.
- Allow higher densities and building heights in exchange for more affordable units. Target densities can be applied in accessible locations, for example, at least three stories along minor arterials and four stories along major arterials.
- Improve affordable housing design. Municipal governments can support contests, planning charrettes and workshops to encourage better design. The Affordable Housing Design Advisor, the Missing Middle Website, and Portland’s Infill Design Project provide resources for improving lower-priced housing design.
In addition to these local and regional policies, state, provincial and federal governments can encourage more compact development and more efficient transportation with policies such as the following.
- Implement Institutional Reforms that support TDM, such as Least-Cost and Comprehensive Transport Planning, and require regional and municipal governments to apply these principles in their own transport planning.
- Provide adequate funding for Public Transit Improvements, Ridesharing Programs and HOV Priority on major corridors.
- Implement Freight Transport Management programs.
- Implement Distance-Based vehicle insurance and registration fees.
- Mandate Commute Trip Reduction programs, as in Washington State.
- Create reliable funding options for Public Transit Improvements and TDM Programs, including special dedicated taxes or a share of overall transportation budgets.
- Choose transportation Funding Options that support TDM, such Fuel Taxes, Carbon Taxes and Road Pricing.
Experience in communities such as Portland, Seattle, San Francisco and Vancouver, demonstrates that more compact development, multi-modal planning and TDM incentives can significantly reduce driving and increase travel by resource-efficient modes. This indicates that such policies can increase walking, bicycling and transit travel by 50-100%, and reduce automobile travel by 20-30%, and more if supported by state/provincial and national strategies such as fuel tax increases and pay-as-you-drive vehicle pricing.
These travel reductions can provide many benefits. Compared with conventional communities, residents of compact, multi-modal communities [pdf]:
- Spend 10-30% less on transportation.
- Consume less energy and produce 20-50% lower pollution emissions [pdf] per capita.
- Have substantially lower traffic casualty rates.
- Are healthier and live longer.
- Have greater economic mobility (chance that children born in lower-income households become economically successful as adults).
- Spend less time driving and delayed by congestion.
- Require less land for roads and parking, which reduces stormwater management costs and heat island effects, and preserves open space (farmland and habitat).
- Reduce costs of providing roads, parking facilities and public services [pdf].
This is good news. Many communities want to reduce traffic problems and transportation emissions, and increase affordability; they can do this with Smart Growth policies that create more accessible, multi-modal neighborhoods, and by significantly increasing the amount of development that occurs there so more households can reduce their vehicle travel and associated costs. This can provide large savings and benefits to those residents and communities.
For More Information
Michelle Byars, Yishu Wei and Susan Handy (2017), State-Level Strategies for Reducing Vehicle Miles of Travel, University of California Institute of Transportation Studies.
CARB (2010-2015), Impacts of Transportation and Land Use-Related Policies, California Air Resources Board.
Sudip Chattopadhyay and Emily Taylor (2012), “Do Smart Growth Strategies Have a Role in Curbing Vehicle Miles Traveled? A Further Assessment Using Household Level Survey Data,” Journal of Economic Analysis & Policy, Vol. 12, Issue 1, pp. 1935-1682, DOI: 10.1515/1935-1682.322.
Eric Eidlin (2010), “What Density Doesn’t Tell Us About Sprawl,” Access 37, University of California Transportation Center, pp. 2-9.
Richard Lee, et al. (2012), Evaluation of the Operation and Accuracy of Five Available Smart Growth Trip Generation Methodologies, Transportation Research Board Annual Meeting paper 12-3949.
Todd Litman (2011), “Can Smart Growth Policies Conserve Energy and Reduce Emissions?” Portland State University’s Center for Real Estate Quarterly, Vol. 5, No. 2, Spring, pp. 21-30. Also see, Critique of the National Association of Home Builders’ Research On Land Use Emission Reduction Impacts, Victoria Transport Policy Institute.
Todd Litman (2016), Win-Win Transportation Emission Reduction Strategies: Smart Strategies Can Achieve Emission Reduction Targets and Provide Other Important Economic, Social and Environmental Benefits, Victoria Transport Policy Institute.
Todd Litman (2017), Understanding Smart Growth Savings: What We Know About Public Infrastructure and Service Cost Savings, And How They are Misrepresented By Critics, Victoria Transport Policy Institute.
Wesley E. Marshall and Norman W. Garrick (2012), “Community Design and How Much We Drive," Journal of Transport and Land Use, Vol. 5, No. 2, pp. 5–21, doi: 10.5198/jtlu.v5i2.301.
Michael West Mehaffy (2015), Urban Form and Greenhouse Gas Emissions Findings, Strategies, and Design Decision Support Technologies, Delft University of Technology.
PIEEE (2015), Achieving California’s Greenhouse Gas Goals: A Focus on Transportation: A Report for Next 10, Policy Institute for Energy, Environment and the Economy, University of California.
Deborah Salon (2014), Quantifying the Effect of Local Government Actions on VMT, UC Davis Institute of Transportation Studies, California Air Resources Board.
Robert J. Schneider, Susan L. Handy and Kevan Shafizadeh (2014), “Trip Generation for Smart Growth Projects,” Access 45; also see the Smart Growth Trip-Generation Adjustment Tool.


Maine Law Promotes Smart Growth
New state legislation encourages cities to plan around ‘smart growth’ principles to preserve farmland and open space, and use infill development to build more housing.
Smart Growth Plan Hopes to Rein in Sprawl in Walla Walla
The Washington city reformed its zoning code to support more multifamily development and a diversity of housing types to meet the needs of its growing population.

The Housing Supply Debate: Evaluating the Evidence
Let's rely on science, not ideology and propaganda, when planning solutions to urban unaffordability. Look for credible evidence in the peer-reviewed publications referenced here.

Maui's Vacation Rental Debate Turns Ugly
Verbal attacks, misinformation campaigns and fistfights plague a high-stakes debate to convert thousands of vacation rentals into long-term housing.

Planetizen Federal Action Tracker
A weekly monitor of how Trump’s orders and actions are impacting planners and planning in America.

San Francisco Suspends Traffic Calming Amidst Record Deaths
Citing “a challenging fiscal landscape,” the city will cease the program on the heels of 42 traffic deaths, including 24 pedestrians.

Defunct Pittsburgh Power Plant to Become Residential Tower
A decommissioned steam heat plant will be redeveloped into almost 100 affordable housing units.

Trump Prompts Restructuring of Transportation Research Board in “Unprecedented Overreach”
The TRB has eliminated more than half of its committees including those focused on climate, equity, and cities.

Amtrak Rolls Out New Orleans to Alabama “Mardi Gras” Train
The new service will operate morning and evening departures between Mobile and New Orleans.
Urban Design for Planners 1: Software Tools
This six-course series explores essential urban design concepts using open source software and equips planners with the tools they need to participate fully in the urban design process.
Planning for Universal Design
Learn the tools for implementing Universal Design in planning regulations.
Heyer Gruel & Associates PA
JM Goldson LLC
Custer County Colorado
City of Camden Redevelopment Agency
City of Astoria
Transportation Research & Education Center (TREC) at Portland State University
Jefferson Parish Government
Camden Redevelopment Agency
City of Claremont