


Few issues are more emotional, and therefore vulnerable to bad analysis, than urban crime risk. Solid research indicates that more compact and mixed development tends to increase neighborhood security. Jane Jacobs was right!

Misconceptions about crime risks are a major barrier to more efficient and equitable urban planning. Residents often oppose compact and mixed development, despite their many economic, social and environmental benefits [pdf], due to misguided fears that density increases neighborhood crime. New research can help us understand how urban design affects crime risks and identify planning strategies to increase community security.
It is easy to understand people’s confusion. In the past, cities had high rates, although these are declining (see below), as are the differences between urban, suburban and rural crime rates. Many people retain exaggerated, outdated impressions of urban crime risks.
Per capita crime rates are also strongly associated with poverty, so crime rates tend to be particularly high in urban areas with concentrated poverty. However, this does not mean that increasing development density necessarily increases poverty and associated crime rates; on the contrary, good research indicates that low-income people have greater economic opportunity and mobility if they live in more accessible and multimodal neighborhoods.
For example, a comprehensive study titled, Does Urban Sprawl Hold Down Upward Mobility? (Ewing, et al. 2016) found that urban mobility (the chance that a child raised in a low-income household becomes more economically successful as an adult) is much higher in compact areas than sprawling areas (doubling the compactness index increases economic mobility by about 41%), apparently due to better job accessibility. Similarly, the study, Does Walkability Matter? An Examination of Walkability’s Impact on Housing Values, Foreclosures and Crime (Gilderbloom, Riggs and Meares 2015) found that in Louisville, KY, all else being equal, more walkable neighborhoods have lower crime and housing foreclosure (a sign of household financial crisis) rates.
Websites such as Crime Mapping and Crime Reports (see below) generally indicate that crime density (reported crimes per square mile or kilometer) increase with the population and business densities, and are particularly high in central urban neighborhoods. This is unsurprising since most human activities, good and bad, increase with population density, and many crimes are associates with particular business types: bank robberies require banks, and drunken assaults are most common near bars.

To account for these factors, crime research should evaluate crime rates per capita, with separate analysis of household and commercial crimes, and account for demographic factors such as age, education, and poverty. To understand how urban design factors affect crime risk requires fine-grained information on factors such as land use mix (particularly the location of high-risk businesses such as liquor stores and bars), roadway design, and building type, as well as geocoded crime data. High quality studies that reflect these practices indicate that, all else being equal, crime rates tend to decline on denser and more mixed streets and blocks, and increased walkability, apparently due to more passive surveillance (what Jane Jacobs called eyes on the street) as more residents and by-passers can see and report possible threats.
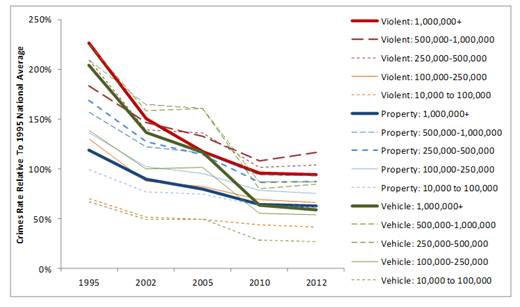
For example, after adjusting for socioeconomic factors such as age, employment status and income, the study, Commercial Density, Residential Concentration, and Crime: Land Use Patterns and Violence in Neighborhood Context (Browning, et al. 2010), found that per capita violent crime rates decline with density in Columbus, Ohio neighborhoods, particularly in the most disadvantaged neighborhoods. Similarly, the study, Predicting Violent Crime Using Urban and Suburban Densities (Christens and Speer 2005) found that violent crime rates decline with density in the Nashville, Tennessee region. High Resolution Analysis of Crime Patterns in Urban Street Networks: An Initial Statistical Sketch From an Ongoing Study of a London Borough [pdf] (Hillier and Sahbaz 2006) found that robberies and burglaries decline on streets that have denser housing, more mixed development and more through traffic; for example, burglaries per house during a five-year period decline from 0.209 on streets with fewer than 11 dwellings, to 0.142 on streets with 50 dwellings, and just 0.086 on streets with more than 100 dwellings, indicating that lower-density streets have more than twice the crime rate as higher-density streets.
Analysis of Urban Vibrancy and Safety in Philadelphia (Humphrey, et al. 2017), used fine-grained geographic data to measure the relationships between urban vibrancy (human activity in an area) and public safety in Philadelphia. They found that, controlling for other factors, crimes associated with commercial activities, such as store robberies and drunken assaults, increase in neighborhoods with more businesses, but crime rates decline on blocks where businesses are open for more hours per week, indicating that all else being equal, businesses suppress crime.
The most recent and detailed study I know of, Danger Zone: Land Use and the Geography of Neighborhood Crime (Twinam 2018) used high-resolution data to evaluate the impacts that residential density and land use mix have on street crime (robbery and assault) in Chicago. The results indicate that crime rates increase near commercial land uses, particularly bars and liquor stores, but this effect is offset by population density; dense mixed-use areas are safer than typical residential areas.
This type of analysis is complicated by poor research methods and limited perspectives, which only consider risks in a limited geographic area, and so treat the relocation of crime to other areas as a benefit rather than a cost shift. For example, many studies simply measure crime density (the number of crimes that occur in an area) without accounting for confounding factors such as poverty and commercial crime risk. Early Crime Prevention Through Environmental Design (CEPTED) research, based on experience in high crime rate urban areas, indicated that limiting public access reduced crime rates, but the analysis was anecdotal and unable to determine whether crime actually decline or simply moved elsewhere. When crimes are evaluated for a small geographic area, excluding low-income households may seem to increase safety, but if this forces lower-income household into suburban areas with less economic opportunity, total regional crimes are likely to increase.
You may want to perform crime research yourself. The City Data website includes various crime statistics and a Crime Index that can be used for geographic comparisons. It is interested to see, for example, that the Crime Index is much lower in urban Los Angeles (347) than nearby suburban San Bernardino (649), and relatively compact Portland, Oregon has a lower Crime Index (410) than sprawled Atlanta, Georgia (613), all of which supports the hypothesis that more compact and multimodal development reduces crime risk. Of course, there are many examples of low-crime suburbs, but these are generally affluent areas, so they do not really prove that suburbanization itself reduces or densification increases crime rates. Only by accounting for income and poverty, and examining neighborhood-level urban-design factors, as some studies do, can we understand how planning affects crime risk.
Of course, crime is just one of many risks to consider. The graph below compares traffic accident, suicide and homicide death rates by community type. This indicates that large cities have significantly higher murder rates, but this is offset by lower traffic accident and suicide rates. Considering all three forms of violence, residents of larger and denser cities are safer and long-living than in small towns and rural areas.
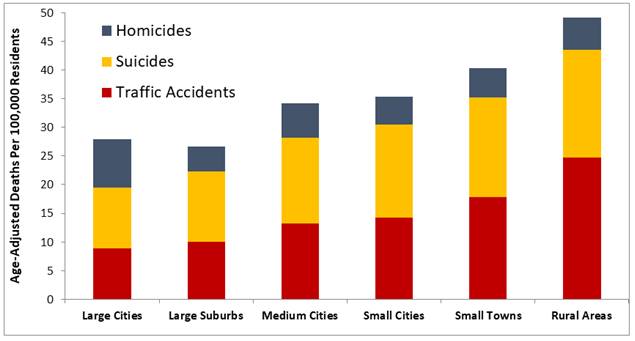
Suburbs have the lowest homicide and total violent death rates, but this reflects their lower poverty rates and fewer higher-risk commercial activities such as banks and bars. Downtown bars tend to attract regional customers to drink and carouse, and sometimes fight among themselves, which increases central city violent crime rates but imposes little risk to nearby residents. Moving from a suburb to a middle-income urban neighborhood is unlikely to cause most people to commit more crimes or significantly increase their chance of being a crime victim.
This is good news for Smart Growth advocates. Solid research indicates that, all else being equal, more compact, mixed and multimodal development tends to reduce overall crime risks, in the short run by increasing passive surveillance, and over the long run by improving disadvantaged residents’ economic opportunity, which helps reduce poverty, a major causes of crime. By improving public fitness and health, and reducing traffic accident and suicide risks, living in a walkable urban neighborhood tends to increase safety, health, and longevity. This is not to deny that bars, liquor stores, and low-income housing tend to increase local crimes, but the risks are primarily internal, fights among bar patrons, store burglaries, and domestic conflicts, with little additional risk to law-abiding residents nearby.
Several previous Planetizen columns have examined how urban planning decisions affect crime, including Risk Versus Dread: Implications for Planners; or Let's Not Let Terrorists Win (Litman 2011); Low Crime Rates In Large Cities Support Multi-Modal Planning and Smart Growth (Litman 2013); 'Two-Ways' to Fix Our Neighborhoods (Gilderbloom and Riggs 2015); Study: 'Eyes on the Street' Have Real Value for Neighborhood Safety (Brasuell 2017); and Falling Crime Rates Have Changed American Cities (Brazeal 2018). Recent columns by Fanis Grammenos, Eyes from the Street: The Neighbourhood Fabric that Matters and Eyes from the Street – A Finer Filter, are good examples of bad research because they fail to account for demographic and geographic factors, and use geographic scales that are too large to measure street-scale effects.
What are the planning implications? When evaluated from a narrow perspective, excluding banks, bars, and poor households from urban neighborhoods may seem to increase safety, but this can simply shift crimes to other locations, and if the excluding poor households have less economic opportunity in their new neighborhoods, this is likely to increase total regional poverty and crime. Increasing neighborhood mix and walkability tends to increase passive surveillance, and allowing lower-income households to live in accessible and economically successful neighborhoods, are probably the best way to reduce crime overall.
People often exaggerate the risks of crime and compared with other risks such as traffic accidents and suicides. Considering all risks, most people are safer living in a mixed neighborhood with nearby bars, because any additional risks of being a bar fight victim is more than offset by the safety of being able to walk rather than drive home after a night of drinking.
For More Information
The American Violence website is designed to make data on violence accessible to public officials, journalists, researchers, and the public at large, allowing users to visualize and analyze trends.
Christopher R. Browning, et al. (2010), “Commercial Density, Residential Concentration, and Crime: Land Use Patterns and Violence in Neighborhood Context,” Journal of Research in Crime and Delinquency, Vol. 47, pp. 329–357 (doi: 10.1177/0022427810365906).
Brian Christens and Paul W. Speer (2005), “Predicting Violent Crime Using Urban and Suburban Densities,” Behavior and Social Issues, Vol. 14, pp. 113-127.
Lei Ding and Jackelyn Hwang (2016), “The Consequences of Gentrification: A Focus on Residents’ Financial Health in Philadelphia,” Cityscape, Vol. 1, No. 3.
Reid Ewing, et al. (2016), “Does Urban Sprawl Hold Down Upward Mobility?,” Landscape and Urban Planning, Vol. 148, April, pp. 80-88.
Chad Frederick and John Hans Gilderbloom (2018), “Commute Mode Diversity and Income Inequality: An Inter-Urban Analysis of 148 Midsize US Cities,” International Journal of Justice and Sustainability, Vol. 23, No. 1.
John I. Gilderbloom, William W. Riggs and Wesley L. Meares (2015), “Does Walkability Matter? An Examination of Walkability’s Impact on Housing Values, Foreclosures and Crime,” Cities, Vol. 42, pp. 13–24 (doi:10.1016/j.cities.2014.08.001).
Bill Hillier and Ozlem Sahbaz (2006), High Resolution Analysis of Crime Patterns in Urban Street Networks: An Initial Statistical Sketch from an Ongoing Study of a London Borough, University College London.
Colman Humphrey, et al. (2017), Analysis of Urban Vibrancy and Safety in Philadelphia, University of Pennsylvania and Stantec.
Johanna Lacoe , Raphael W. Bostic , Arthur Acolin (2018), “Crime and Private Investment in Urban Neighborhoods,” Journal of Urban Economics.
Tate Twinam (2017), “Danger Zone: Land Use and the Geography of Neighborhood Crime,” Journal of Urban Economics, Vol. 100, pp. 104-119 (http://dx.doi.org/10.1016).


Planners’ Complicity in Excessive Traffic Deaths
Professor Wes Marshall’s provocatively-titled new book, "Killed by a Traffic Engineer," has stimulated fierce debates. Are his criticisms justified? Let’s examine the degree that traffic engineers contribute to avoidable traffic deaths.

Falling Crime Rates Have Changed American Cities
The drop in crime in cities has extended American life expectancies, especially those of black men, and brought more wealthy people into urban areas.

A New Traffic Safety Paradigm
Despite numerous traffic safety programs, traffic death rates have not declined in a decade and recently started to increase. We can do better! A new paradigm identifies additional safety strategies that reduce both crash rates and risk exposure.

Planetizen Federal Action Tracker
A weekly monitor of how Trump’s orders and actions are impacting planners and planning in America.

Chicago’s Ghost Rails
Just beneath the surface of the modern city lie the remnants of its expansive early 20th-century streetcar system.

San Antonio and Austin are Fusing Into one Massive Megaregion
The region spanning the two central Texas cities is growing fast, posing challenges for local infrastructure and water supplies.

Since Zion's Shuttles Went Electric “The Smog is Gone”
Visitors to Zion National Park can enjoy the canyon via the nation’s first fully electric park shuttle system.

Trump Distributing DOT Safety Funds at 1/10 Rate of Biden
Funds for Safe Streets and other transportation safety and equity programs are being held up by administrative reviews and conflicts with the Trump administration’s priorities.

German Cities Subsidize Taxis for Women Amid Wave of Violence
Free or low-cost taxi rides can help women navigate cities more safely, but critics say the programs don't address the root causes of violence against women.
Urban Design for Planners 1: Software Tools
This six-course series explores essential urban design concepts using open source software and equips planners with the tools they need to participate fully in the urban design process.
Planning for Universal Design
Learn the tools for implementing Universal Design in planning regulations.
planning NEXT
Appalachian Highlands Housing Partners
Mpact (founded as Rail~Volution)
City of Camden Redevelopment Agency
City of Astoria
City of Portland
City of Laramie