


Evidence described here suggests that urban design for "eyes on the street" is not enough to lower crime.
We argued recently that the Jacobsian dictum "eyes on the street" fails to explain crime statistics of my home city and its neighbourhoods. We concluded that social fabric is a far better predictor of a neihbourhood's crime rate than its physical attributes. Commentators mostly agreed, but some doubted whether the corroborating correlations told the whole story. Here we add pieces to the puzzle, which may now reveal a more legible picture.

Researchers agree that averages, medians, and bundled up data can hide important, even critical, facts. On this basis, we first ask: Which are the risky at the top of the aggregate crime-related stats? And, later, what can explain their rank? To answer them we zoom in and add filters.
Of the 20 typical police categories of crime, three stand out as most unsettling events, which frequently make headlines: Homicides, Assaults, and Break-Ins. They are also the ones usually reported to authorities. Using only these three statistics in this analysis removes the obstacle of unreported incidents that often plague statistical accuracy. These "core" crime types amount to only 18% of the total number of transgressions, thus reducing potential "noise" from frequent but unimportant events. To identify the "most unsafe" neighbourhoods among the hundred, we look at these three separately and collectively.
Death-causing violations
Violence resulting in death tops the safety fears of city residents. Such events are rare in this city and most neighbourhoods (64%) report zero instances. In a six-year period (2011-2016), only 36 list one or more episodes. To sharpen the picture, we focus on only 11 neighbourhoods that reported two or more incidents—a number chosen to filter the riskiest among them.

Byward Market emerges by far the riskiest on this metric. It exceeds the next highest by more than 150% and registers twice the average rate (29) of this set. This inordinately high number deserves a closer look. With the exception of this outlier, the remaining ten neighbourhoods cover a tenfold rate range from four to 41 deaths per 100k, suggesting relative safety in the lower ranks.
Assaults
Assaults leave an indelible experience and darken the perception of a community. To weed out districts unlikely to reach a top rank on this count, we include only communities with more than double the incident average of the city (26). This threshold results in 14 communities being considered from a total of a 100 (Fig 3).
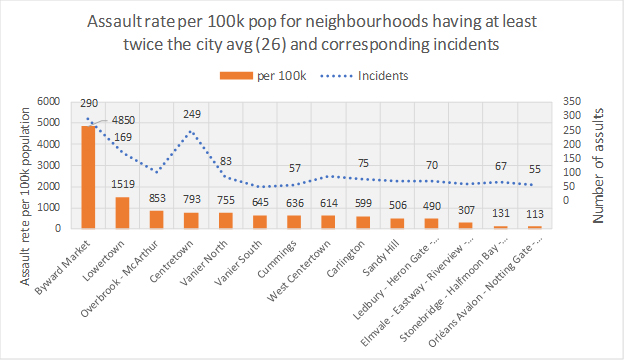
Byward Market again exceeds the average rate of the group (612) eightfold and by three times the next highest. Excepting this outlier, the remaining 13 neighbourhoods range from 113 to 1519 per 100k, a 13-fold difference, indicative of relatively safe conditions at the lower ranks.
Break and Enter
Break and Enter incidents cause neighbourhood anxiety, are telegraphed instantly by neighbours, and lower a district's safety capital. Since reported numbers are mute on whether the perpetrators are residents or outsiders, they are simply taken as indicative of the frequency that a neighbourhood is a target. Frequency speaks to its relative safety. It also implicates the potential role that "eyes on the street" could play in abating such incidents. "Eyes," if present and effective, would simply act as a deterrent (passive or active) to avert an event irrespective of the perpetrator's origin. Neighbourhoods with twice the incident rate of the city average are chosen in order to filter the top contenders.

An abnormal statistic emerges in this group too: A neighborhood with the highest rate but, also, with the lowest number of incidents; an anomalous case deserving attention. It has over double the rate of the next highest district and over triple this group's average. Setting this outlier aside temporarily, the remaining group of 13 neighbourhoods, cover a tenfold range, implying that the risk declines rapidly even in this "risky" group.
Communities change rank in each crime category or fall below the specific threshold entirely.
Three crime-types into one set
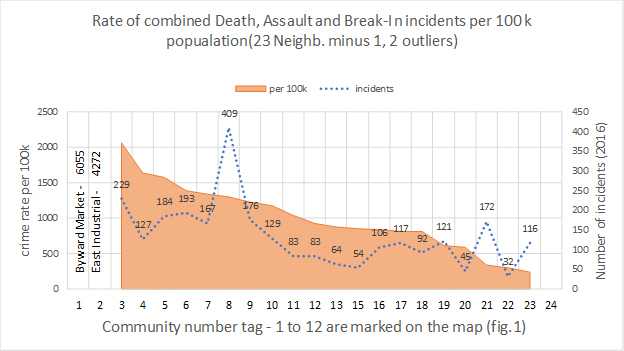
To spot the top contenders in the whole city, we combine all three sets of crime-type rates into one. From this mix, 23 communities emerge as "risky." This combination reshuffles their rank again in the final set. Using this group's average as a threshold, we separate the top 12 from the rest (Fig 5 and Fig 1).
Lessons from the outliers
In Fig. 5, two outlier districts were omitted for their inordinately anomalous figures: East Industrial and Byward Market (1,2). The first consists of six adjoining industrial or business parks. Its 10 times (14 km2) larger area than the latter (1.2 km2) but houses only half the latter's population (2,235 vs 4,835). This low population base inevitably translates into a high crime rate in spite of the lowest episode count (79). Its rate is simply a statistical aberration due to an overwhelming preponderance of non-resident, working population which eludes the calculation.
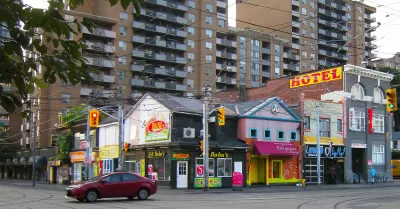
Similarly, population size may also be a factor in the case of Byward Market, having only one third this group's average. An additional, and stronger, explanation for its outlier status could be its night-time life. Of all the city's districts, it boasts the highest concentration of establishments catering to tourists; a claim to desirable vibrancy but also a fertile ground for unruly behaviour. East Industrial confirms this tendency by being the second highest in that metric.
Squaring with the dictum
Using this filtered number of city neighbourhoods that typify higher risk, we test again the possible association between income and crime activity. This test yields a strong correlation (Fig 6).

We also test for the Jacobsian dictum of a "compact, mixed use" neighbourhood "with eyes on the street." We do so by using density as a proxy (and, indisputably, a prerequisite) for compactness and, secondly, by counting three non-residential uses, also a proxy, for land-use mix: convenience stores, restaurants, and bars.
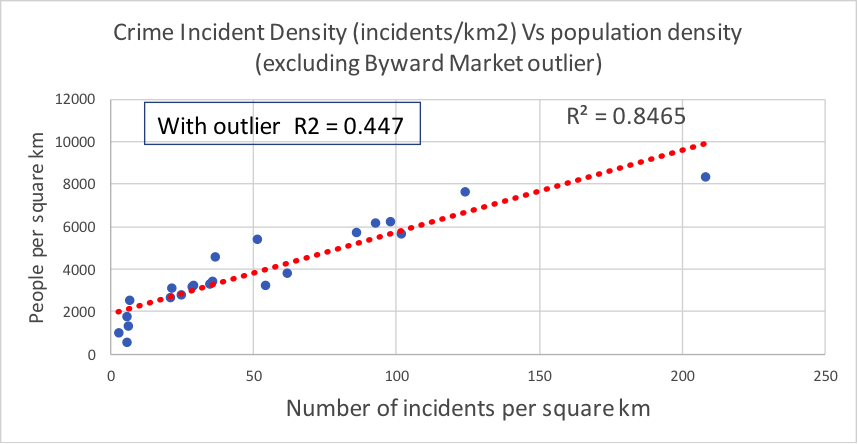
The population density correlations (0.8465 or 0.447) undermine the "compact" element of the theory. In this case, increased compactness associates with decreased safety.
The second test for the impact of land use mix also produces a negative correlation.

This result undermines the assumption that a mix of land uses, which increases pedestrian traffic and, consequently, brings more "eyes on the street," would result in greater safety. It suggests that the very element that ensures diversity and vibrancy in a district may not improve safety; in fact, it could degrade it.
City programming
So far, all the evidence on the inherent characteristics of a district—the sum total of its physical fabric – point to an inconsequential, even negative, role of the built environment in ensuring safety. But a "city" also encompasses functional and operational elements, such as law enforcement practices and social policies and programs, among others—intangible but vital. These intangible elements underpin an incidental, but incontrovertible, evidence for the lesser role of the built environment, of instance, New York's case of crime reduction. In 1990, the city reported a staggering 2,245 homicides. In 2017, the total was 290—a nearly tenfold drop; proof that a city can become much safer while its physical attributes remain unchanged.
Summary
Surveying the 23-neighbourhood sample and the top 12 on the map we find that lower income levels and elevated density are highly prevalent among them: 16 of the 23 and 11 of the map's 12 are among the most economically disadvantaged neighbourhoods in the city. Ditto with population density: eight of the 12 on the map have a density rank in the top quarter of the city range. Similarly, nine of the 12 on the map score high in the non-residential uses rate, four of which exceed the average (2.4) multiple times. Most are older districts, often historic, at or around past city focal points. They display diversity and character of building types associated with their relatively long evolution.
From this filtered sample of 23 neighbourhoods we learn again that the key characteristics that underpin the theory of "eyes on the street"—compactness, diversity of uses and vibrancy—show a negative correlation with safety. We also re-establish that income, even when not including the wealthier, "exclusionary," peripheral neighbourhoods, still predicts a strong association with crime frequency. Such negative associations raise the question ofappropriatedensity and land use diversity, if these are deemed essential ingredients in community planning for other reasons.
In contrast to these unpromising findings, New York's crime reduction example highlights a pragmatic opportunity to shift away from design-centric efforts toward programing-minded initiatives.

Eyes from the Street: The Neighbourhood Fabric that Matters
The mantra “eyes on the street" focuses on the physical and functional traits of urban fabric but fails to explain the high crime rate of my Jacobsian neighbourhood. Time to reconsider, look for explanations, and exchange mantras for research.

Study: 'Eyes on the Street' Have Real Value for Neighborhood Safety
The first study to make an attempt at quantifying the value of "eyes on street"—an idea most eloquently described by Jane Jacobs—offers reason to support a mix of uses, with businesses operating later in the evening.
New Report Challenges 'Eyes on the Street' Concept
In the fifty years since Jane Jacobs introduced the "eyes on the street" theory, it's become a commonly accepted conceit that a mix of use reduces crime. A new study calls that theory into question.

Planetizen Federal Action Tracker
A weekly monitor of how Trump’s orders and actions are impacting planners and planning in America.

Map: Where Senate Republicans Want to Sell Your Public Lands
For public land advocates, the Senate Republicans’ proposal to sell millions of acres of public land in the West is “the biggest fight of their careers.”

Restaurant Patios Were a Pandemic Win — Why Were They so Hard to Keep?
Social distancing requirements and changes in travel patterns prompted cities to pilot new uses for street and sidewalk space. Then it got complicated.

Albuquerque Route 66 Motels Become Affordable Housing
A $4 million city fund is incentivizing developers to breathe new life into derelict midcentury motels.

DC Area County Eliminates Bus Fares
Montgomery County joins a growing trend of making transit free.

Platform Pilsner: Vancouver Transit Agency Releases... a Beer?
TransLink will receive a portion of every sale of the four-pack.
Urban Design for Planners 1: Software Tools
This six-course series explores essential urban design concepts using open source software and equips planners with the tools they need to participate fully in the urban design process.
Planning for Universal Design
Learn the tools for implementing Universal Design in planning regulations.
Heyer Gruel & Associates PA
JM Goldson LLC
Custer County Colorado
City of Camden Redevelopment Agency
City of Astoria
Transportation Research & Education Center (TREC) at Portland State University
Camden Redevelopment Agency
City of Claremont
Municipality of Princeton (NJ)