


Disease mapping made a significant leap forward in the 19th century, and data scientists and geographic information scientists are still contributing to the public health field.
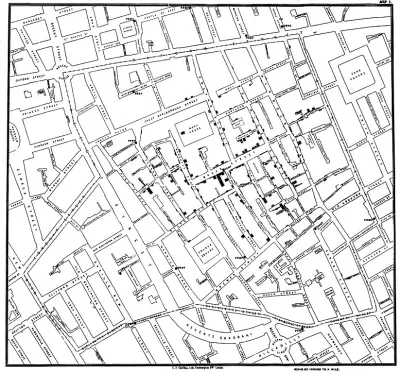
A post on the Sidewalk Labs blog explains an 1854 disease map that "changed the way cities studied public health."
"While many other innovations help keep city residents safe—sewers, fire safety, and vaccines all have more immediately observable effects—the disease map stands out for its ability to change the way we think about population health," according to the post.
Earlier attempts at mapping disease outbreaks failed due to bad assumptions and faulty science, but in 1854 John Snow mapped a London cholera outbreak and totally changed the public health profession's approach to epidemiology—and contributed to a new era of urban growth and industry. (It's no surprise, then, that Snow is often credited as the "father of epidemiology".)
Sidewalk Labs shares Snow's cholera map as the latest installment in the "15 Innovations That Shaped the City" series. According to the post, practices related to data collection and mapping continue to improve, and urban populations can expect even more improvements in public health.
FULL STORY: Disease Mapping: New Technology Meets an Ancient Discipline


Herd Immunity Finds Receptive Audience in White House and Florida
A trio of epidemiologists from Stanford, Harvard, and the University of Oxford have joined the president's new coronavirus medical advisor, Scott Atlas, in promoting an alternative approach to dealing with coronavirus infections.

Study: London ULEZ Rapidly Cleaning up Air Pollution
Expanding the city’s ultra low-emission zone has resulted in dramatic drops in particle emissions in inner and outer London.

London Low-Emissions Zone Prompts Shift to Active Modes
More children are using active transportation modes to get to school in the wake of a policy that charges drivers to enter a low-emissions zone in central London.

Planetizen Federal Action Tracker
A weekly monitor of how Trump’s orders and actions are impacting planners and planning in America.

San Francisco's School District Spent $105M To Build Affordable Housing for Teachers — And That's Just the Beginning
SFUSD joins a growing list of school districts using their land holdings to address housing affordability challenges faced by their own employees.

The Tiny, Adorable $7,000 Car Turning Japan Onto EVs
The single seat Mibot charges from a regular plug as quickly as an iPad, and is about half the price of an average EV.

With Protected Lanes, 460% More People Commute by Bike
For those needing more ammo, more data proving what we already knew is here.

In More Metros Than You’d Think, Suburbs are Now More Expensive Than the City
If you're moving to the burbs to save on square footage, data shows you should think again.

The States Losing Rural Delivery Rooms at an Alarming Pace
In some states, as few as 9% of rural hospitals still deliver babies. As a result, rising pre-term births, no adequate pre-term care and "harrowing" close calls are a growing reality.
Urban Design for Planners 1: Software Tools
This six-course series explores essential urban design concepts using open source software and equips planners with the tools they need to participate fully in the urban design process.
Planning for Universal Design
Learn the tools for implementing Universal Design in planning regulations.
Smith Gee Studio
City of Charlotte
City of Camden Redevelopment Agency
City of Astoria
Transportation Research & Education Center (TREC) at Portland State University
US High Speed Rail Association
City of Camden Redevelopment Agency
Municipality of Princeton (NJ)