


The Innovations in Government Program at the Harvard Kennedy School’s Ash Center for Democratic Governance and Innovation has announced the first winner of the "Map of the Month" contest.
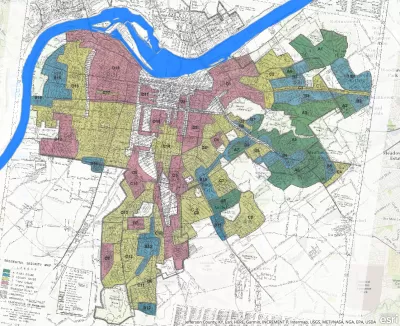
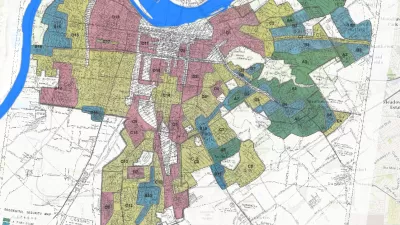
Eric Bosco announces the winner of Harvard University's first "Map of the Month" contest. The winning map, called "Redlining Louisville: The History of Race, Class, and Real Estate," was created by the Louisville Office of Redevelopment Strategies to coordinate with a year-long series of public events "to promote community dialogue on the issue of redlining," reports Bosco. (Redlining, as defined by Bosco, is "the denial of services or the refusal to grant loans or insurance to certain neighborhoods based on racial and socioeconomic discrimination.")
According to the history revealed by the map, redlining came to Louisville 80 years ago, and the problem persists to this day, with what Jeana Dunlap, director of redevelopment strategies in Louisville, calls "digital redlining tendencies," with access to broadband internet, health and medical services, and grocery stores.
"The map combines a variety of datasets — vacant properties, building permits, and property values — and includes the original 1937 HOLC Louisville residential security assessment map indicating neighborhood desirability for investment that illustrates the historic redlining. Users can compare HOLC data with current census tract data by property values, race, vacant properties, and home ownership locations," writes Bosco.
The Map of the Month contest recognizes the best data visualizations created by all levels of government and nonprofits, according to Bosco.
FULL STORY: Map of the Month: Redlining Louisville


New Mapping Tool Illuminates the Consequences of Redlining
According to Next City, a new mapping tool from the National Community Reinvestment Coalition reveals the roots of gentrification in addition to making stark a history of discrimination.

Mapping Richmond’s Displaced Communities
A new project catalogs the city’s history of displacement and its impact on communities of color.
Story Mapping the Racism in Planning History
A Story Map created by the Louisville Metro Office of Planning & Design Services offers a detailed, visual presentation of the history of racism and discriminatory in the planning and zoning of the Louisville and Jefferson County.

Montreal Mall to Become 6,000 Housing Units
Place Versailles will be transformed into a mixed-use complex over the next 25 years.

Planetizen Federal Action Tracker
A weekly monitor of how Trump’s orders and actions are impacting planners and planning in America.

DARTSpace Platform Streamlines Dallas TOD Application Process
The Dallas transit agency hopes a shorter permitting timeline will boost transit-oriented development around rail stations.

Interactive Map Reveals America's “Shade Deserts”
Launched by UCLA and American Forests to combat heat-related deaths, the tool maps the shade infrastructure for over 360 U.S. cities.

Bicycles and Books — In Sacramento, Libraries Now Offer Both
Adult library card holders can check out e-bikes and e-trikes for up to one week.

Colorado Landfills Emit as Much Pollution as 1M Cars
Landfills are the third-largest source of methane pollution in Colorado, after agriculture and fossil fuel extraction.
Urban Design for Planners 1: Software Tools
This six-course series explores essential urban design concepts using open source software and equips planners with the tools they need to participate fully in the urban design process.
Planning for Universal Design
Learn the tools for implementing Universal Design in planning regulations.
City of Mt Shasta
City of Camden Redevelopment Agency
City of Astoria
Transportation Research & Education Center (TREC) at Portland State University
US High Speed Rail Association
City of Camden Redevelopment Agency
Municipality of Princeton (NJ)